Climate physics · evidence summary
Turn up the CO₂. Separate forcing from warming.
A convincing warming chart needs a controlled experiment. Changing a setup label is not enough: the actual radiation input must receive the intended CO₂ value.
The research prompt
Original research prompt
can you think of a quick an simple simulation that demonstrate climate change by increasing CO2? need to be very computation light one
Six experiments. Two distinct responses.
At 280, 560, and 1,120 ppm, fixed-temperature runs isolate energy forcing while slab-ocean runs allow warming. Select a saved scenario below to compare the results.
Idealized aquaplanet with a 30 m slab ocean, without realistic land, sea ice, seasons, or ocean circulation. These responses are not an Earth climate-sensitivity estimate.
The recorded investigation
Turn a broad request into controlled experiments
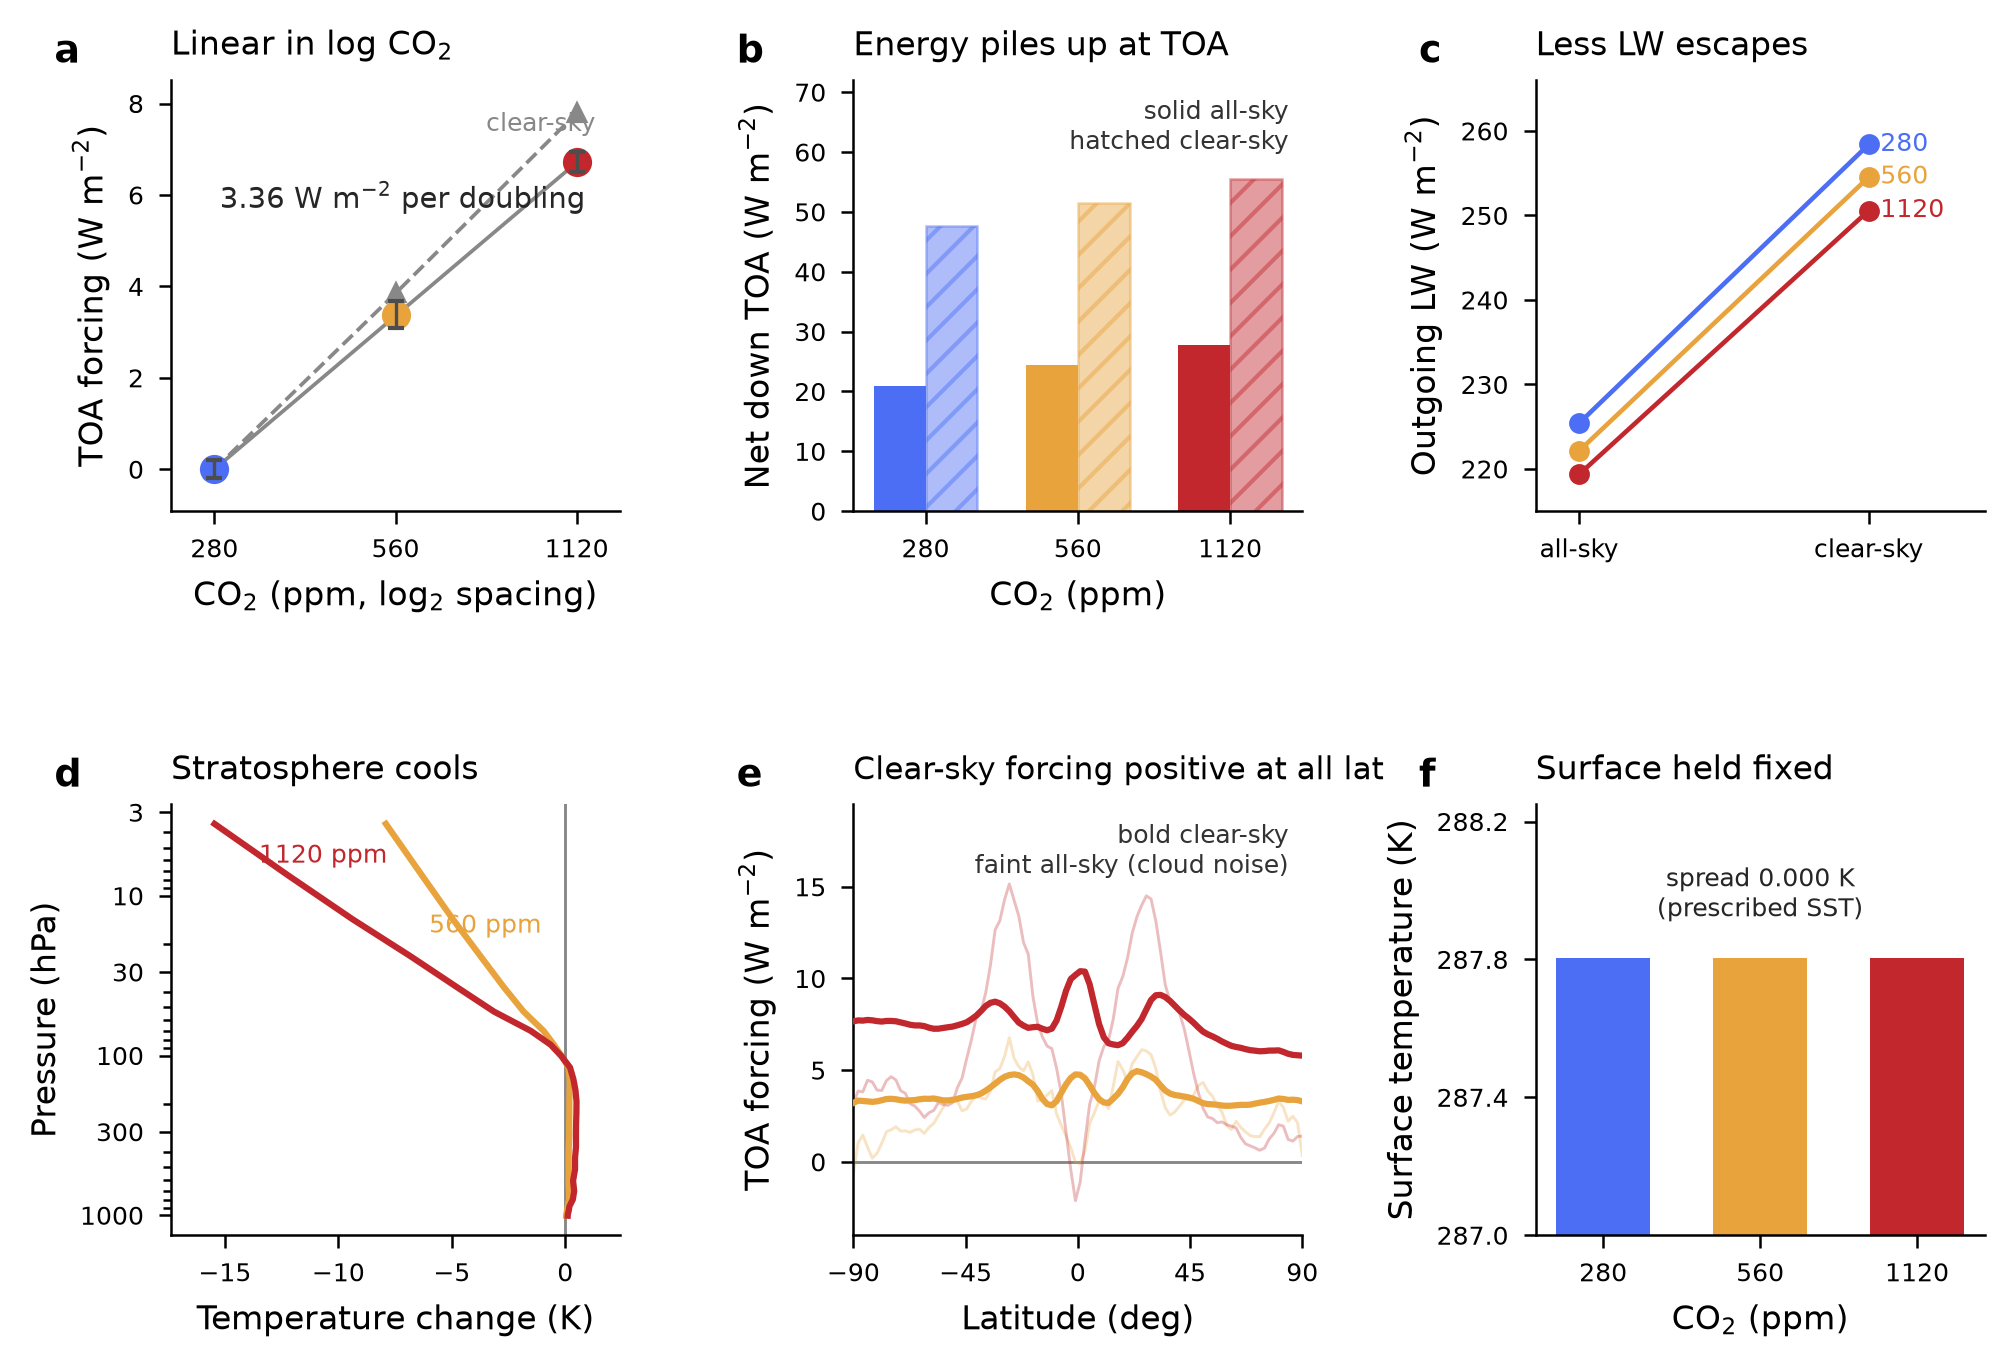
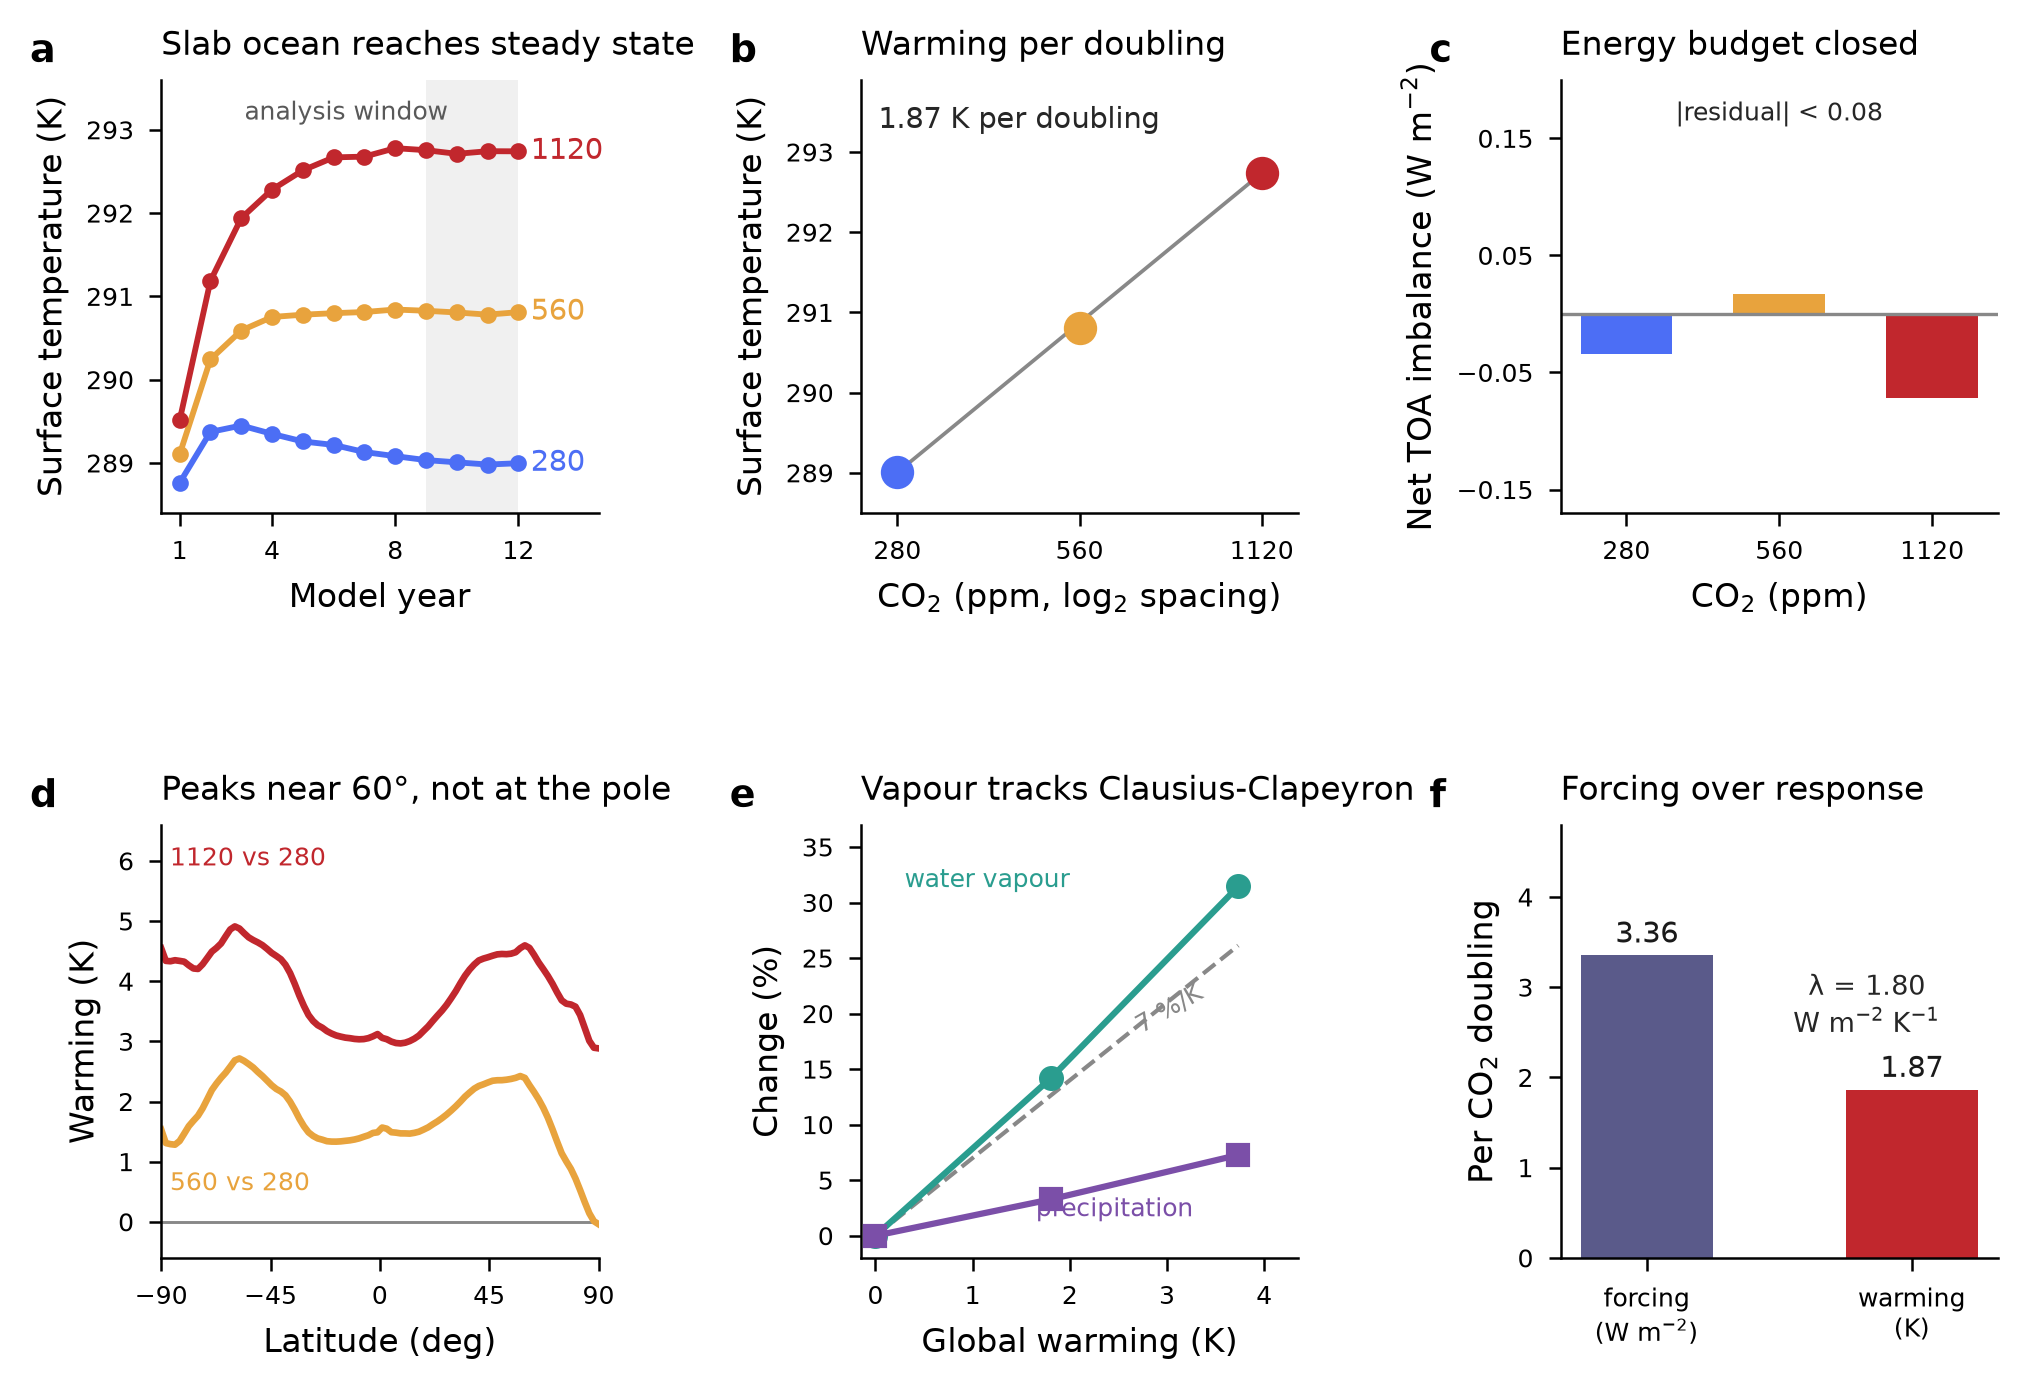
After the user specified CESM, the study compared 280, 560 and 1,120 ppm in two setups: fixed sea-surface temperature and a 30 m slab ocean.
Verify the setting reaches the physics
The record identified a parameter-propagation issue and checked co2vmr in the atmosphere input. Otherwise different case labels could represent the same radiative input.
Separate forcing from warming
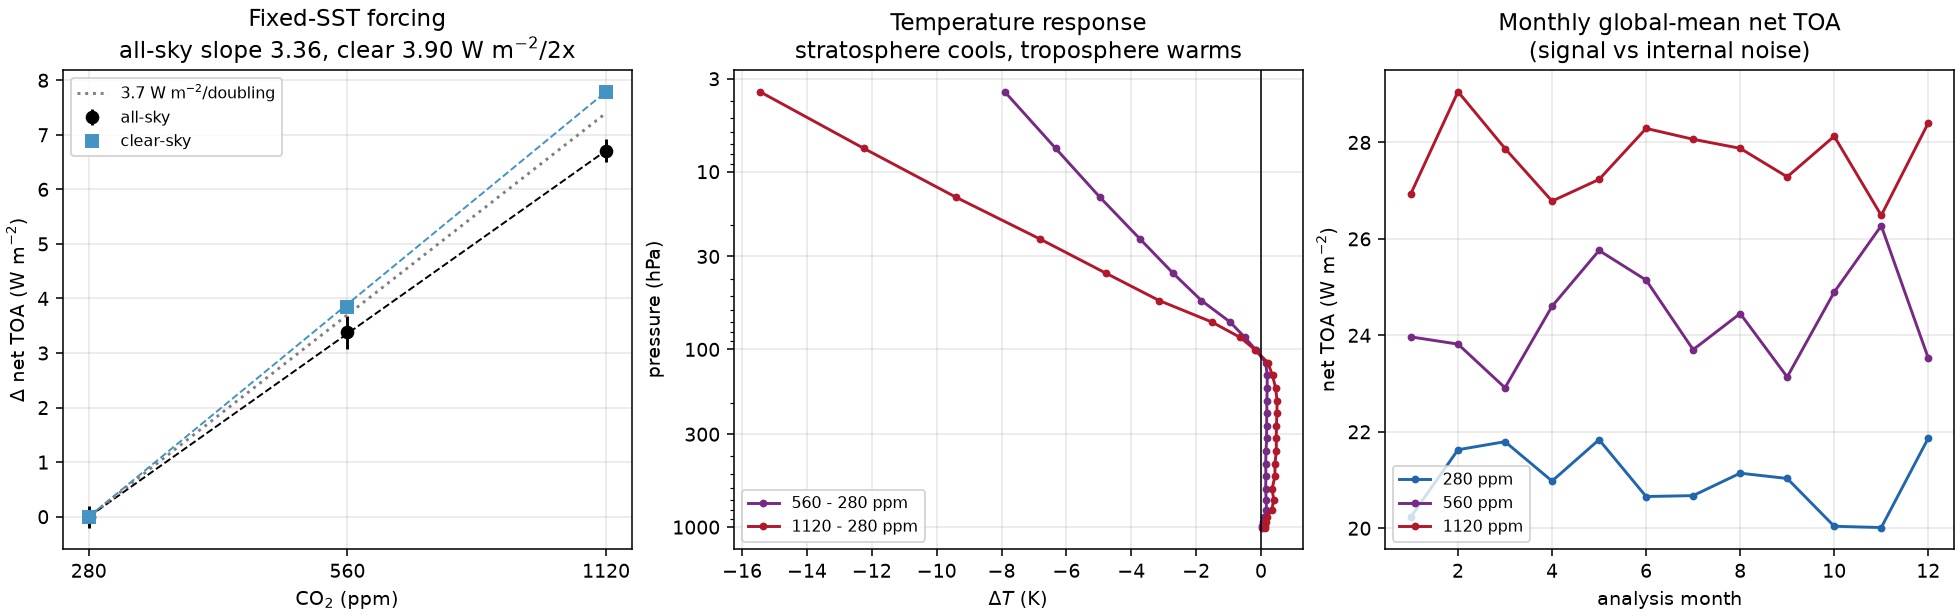
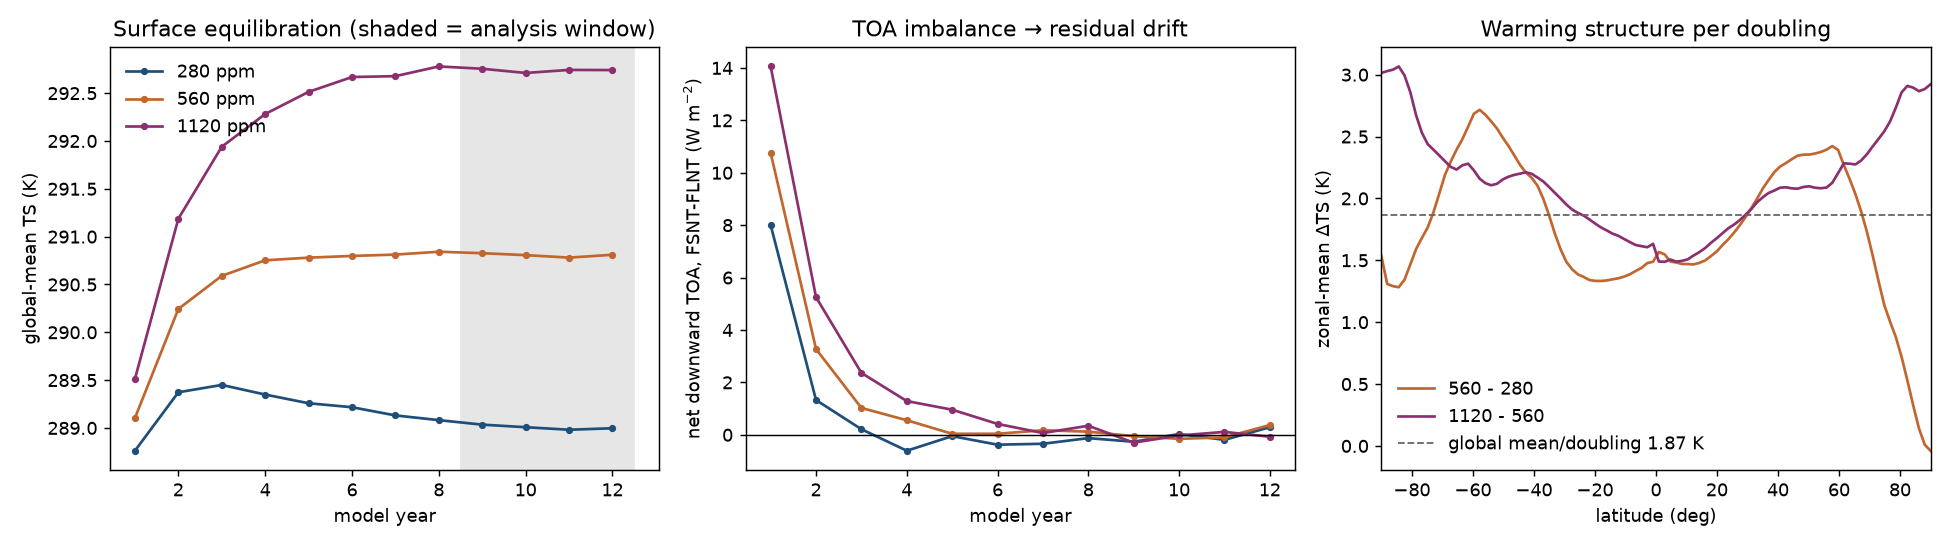
Fixed-SST experiments ran 14 model months; slab-ocean experiments ran 12 model years. The selected analysis uses the final 12 months and years 9–12 respectively.
Deliver an interpretable comparison
Two diagnostic tables, two original figures, reduced model files, explanatory movies and a five-page report carry the experiment into a reviewable handoff.
Where the conclusion stops
- The aquaplanet has no realistic land, sea ice, seasons or ocean circulation. Its 1.87 K response is not an estimate of Earth’s climate sensitivity.
- The maximum absolute final slab-ocean energy imbalance is about 0.072 W/m²; that is a model diagnostic, not real-world validation.
- A five-page article and persuasive movie do not independently establish predictive accuracy.
- The record includes human direction and revisions; human effort and compute costs were not measured as a matched baseline.
The next useful test
Repeat with richer physical components and independent validation before making an Earth-system prediction.
Selected scientific files
These files support inspection of the study. They are not a complete package of run inputs, dependencies or raw outputs. Scientific scripts are provided for reading; this website does not execute them.
- camdiag.py
- co2_climate_change.mp4
- co2_climate_change_whatsapp.mp4
- co2_climate_change_whatsapp_status.mp4
- co2_scene.py
- co2_sweep_diagnostics.csv
- ebm.py · public copy
- fig_fixedsst_forcing.png
- fig_slabocean_warming.png
- fixedsst_co2_diagnostics.csv
- fixedsst_co2_explore.png
- fixedsst_profiles.csv
- slabocean_annual_series.csv
- slabocean_co2_diagnostics.csv
- slabocean_explore.png
- slabocean_zonal_warming.csv
Public copy: internal compute identifiers and local environment paths were removed or generalized. Scientific values are retained. Paths may need adapting and some original run inputs are not included.
This is an editorial evidence summary of a recorded investigation, including later requests and review. The prompt animation is a presentation of saved work, not a live simulation. Human time saved was not measured.