Atmospheric dynamics · evidence summary
Watch a small atmospheric disturbance grow.
Getting a model to finish is only the first step. Someone still has to identify the mechanism, extract the right quantities and make the result understandable.
The research prompt
Research prompt · edited for public presentation
Run a small CESM real-physics smoke test, from case setup through completed output.
Ten days of growing weather patterns.
Expanded from the initial one-day request, the investigation produced a ten-day atmospheric-wave study, diagnostic tables, a globe artifact, and explanatory movies.
Idealized model dynamics. The 214× figure measures pressure-wave growth, not computational speed or forecast accuracy.
The recorded investigation
Run an idealized physical atmosphere
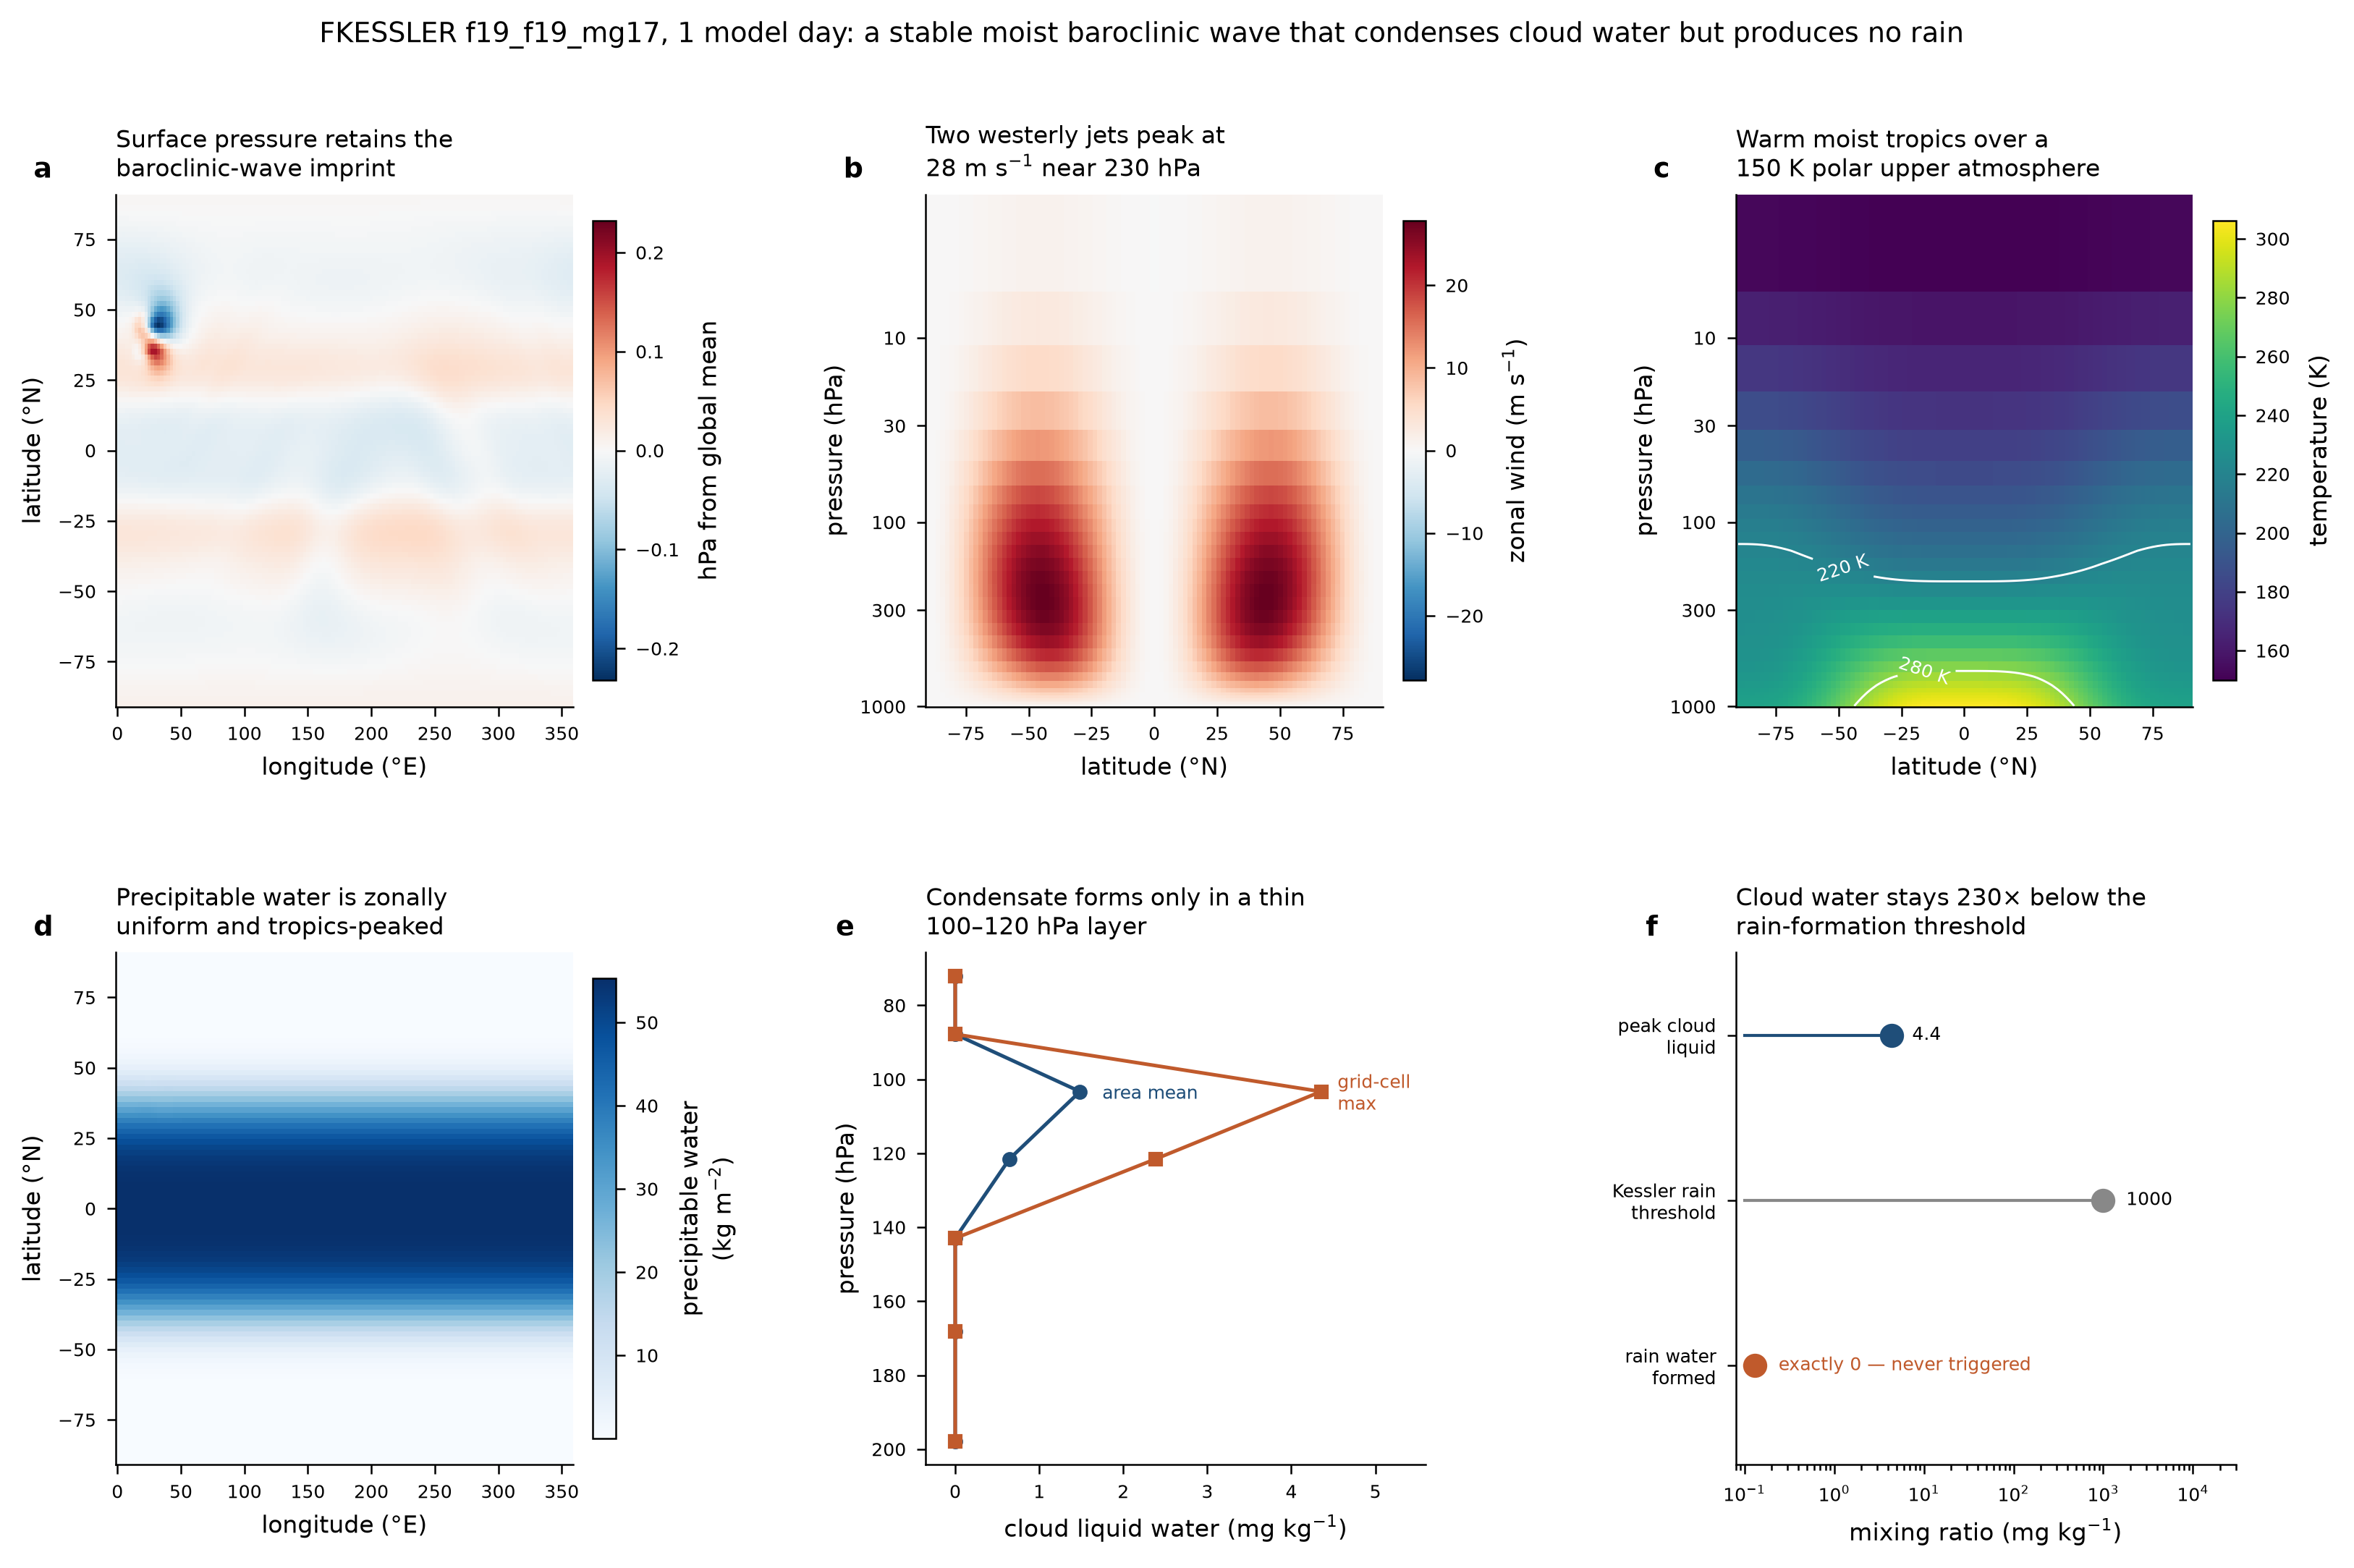
The initial request was a one-day FKESSLER test. The discussion then extended the run and requested a ten-day 3D explanation.
Measure the disturbance as it grows
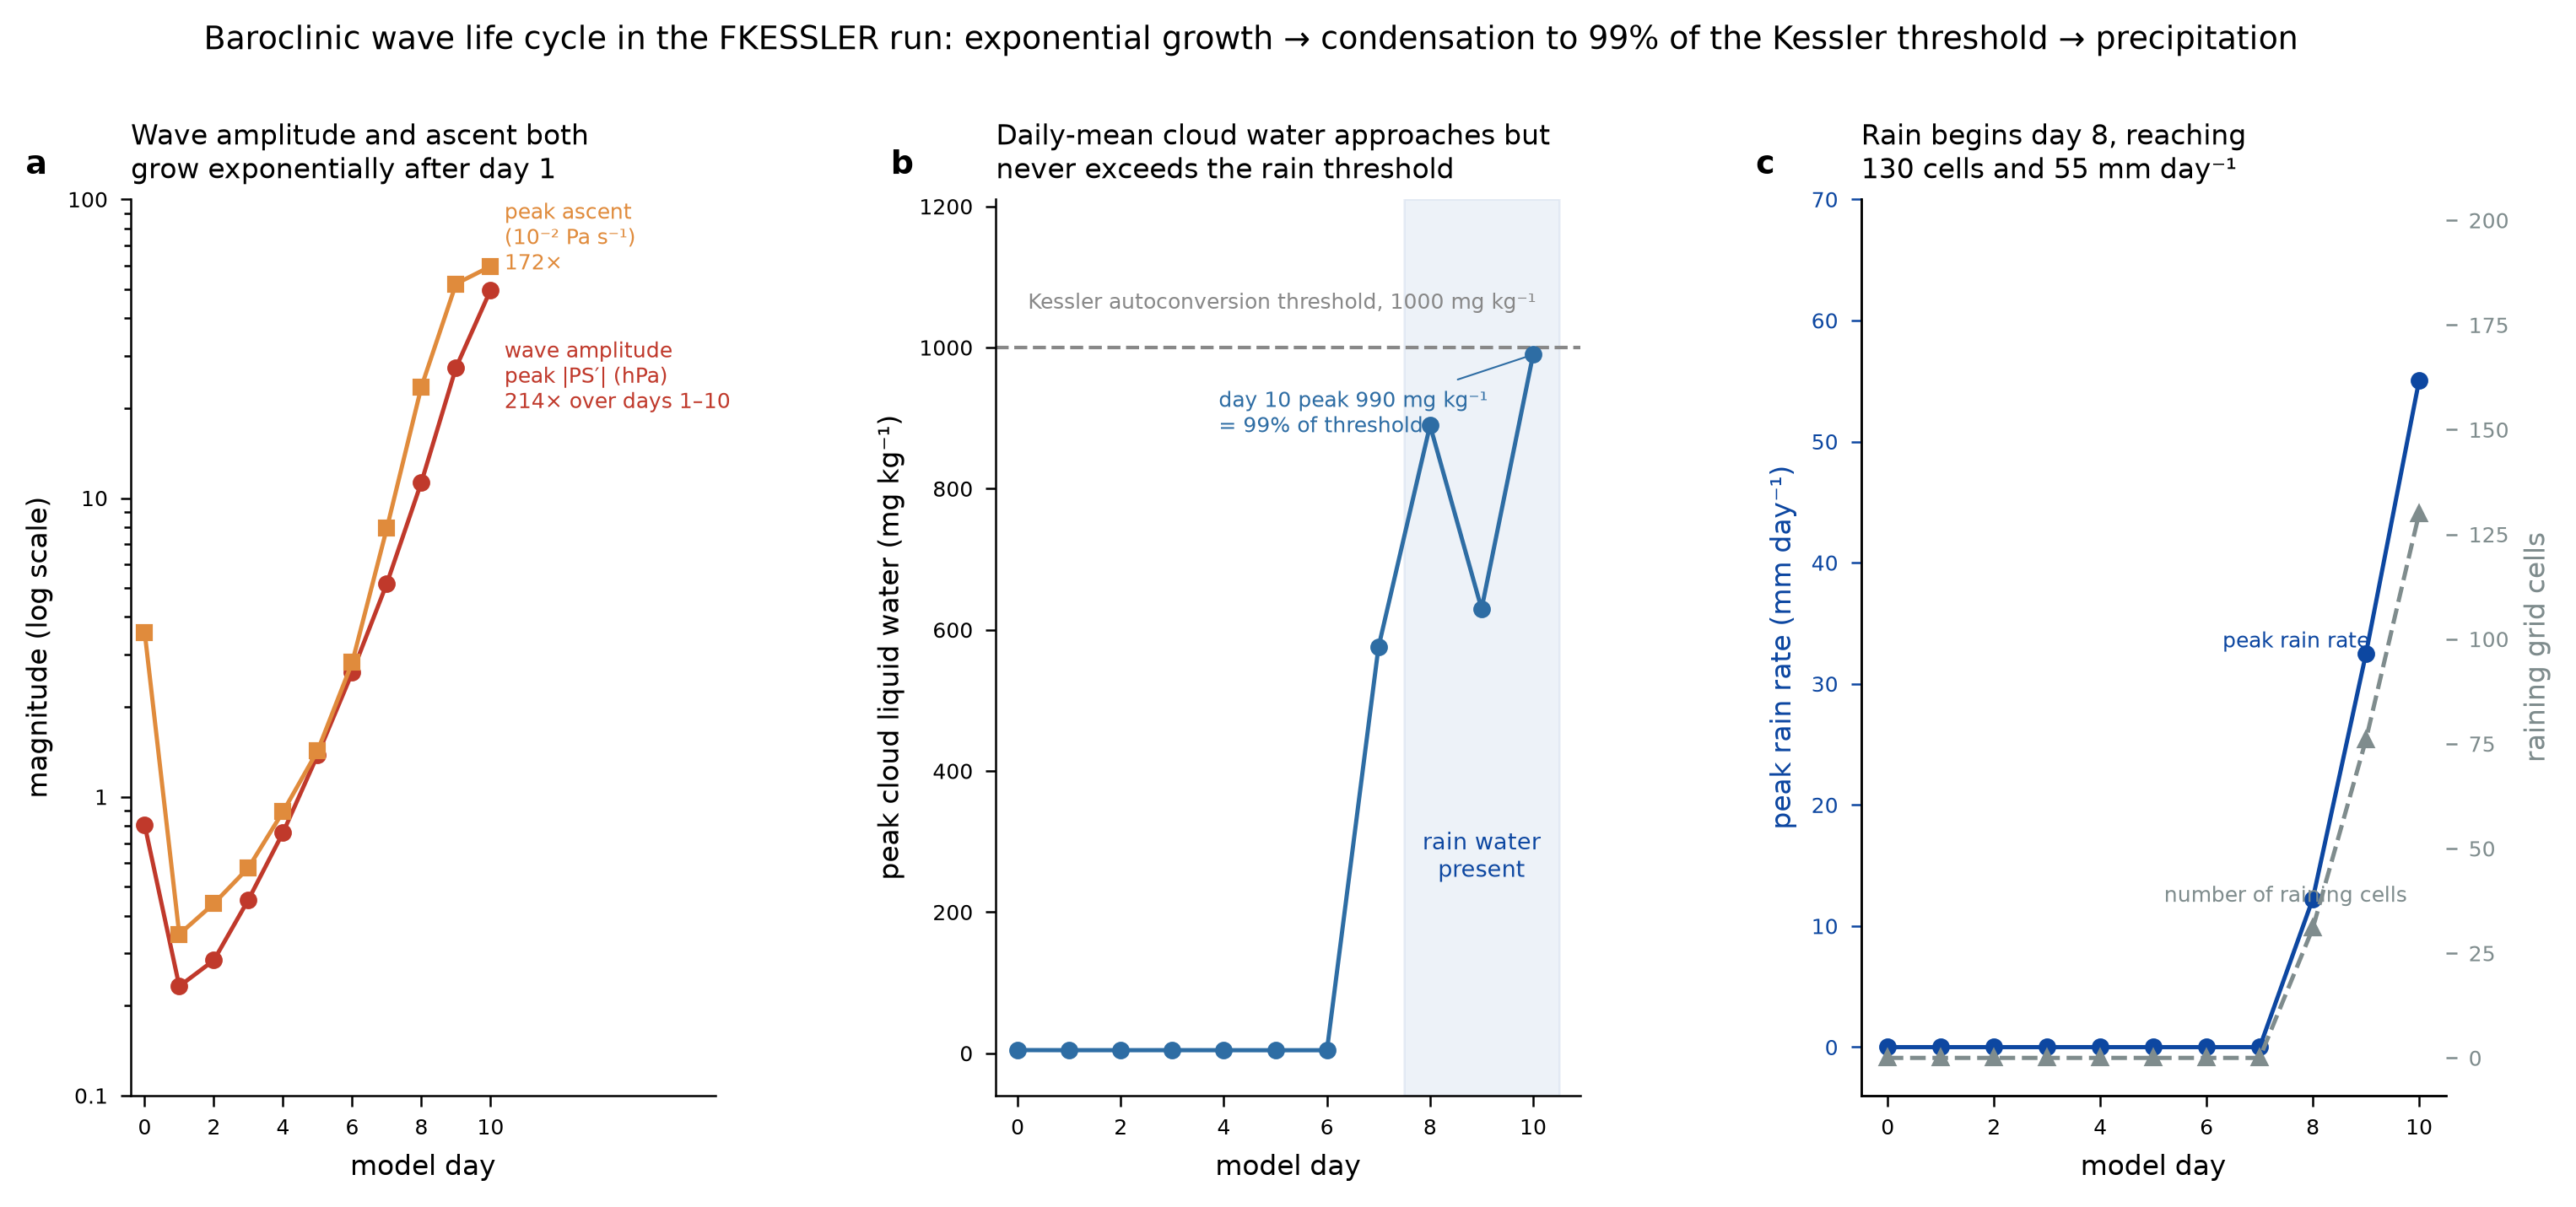
The supplied lifecycle CSV tracks pressure-wave amplitude, ascent, cloud water and rain. Day 1 to day 10 pressure amplitude grows from 0.2323 to 49.7354 hPa.
Correct the explanation
Review corrected a misleading growth-time caption and the treatment of the initial snapshot. Final charts distinguish pressure growth from ascent growth and avoid a false cloud-threshold crossing.
Package the scientific story
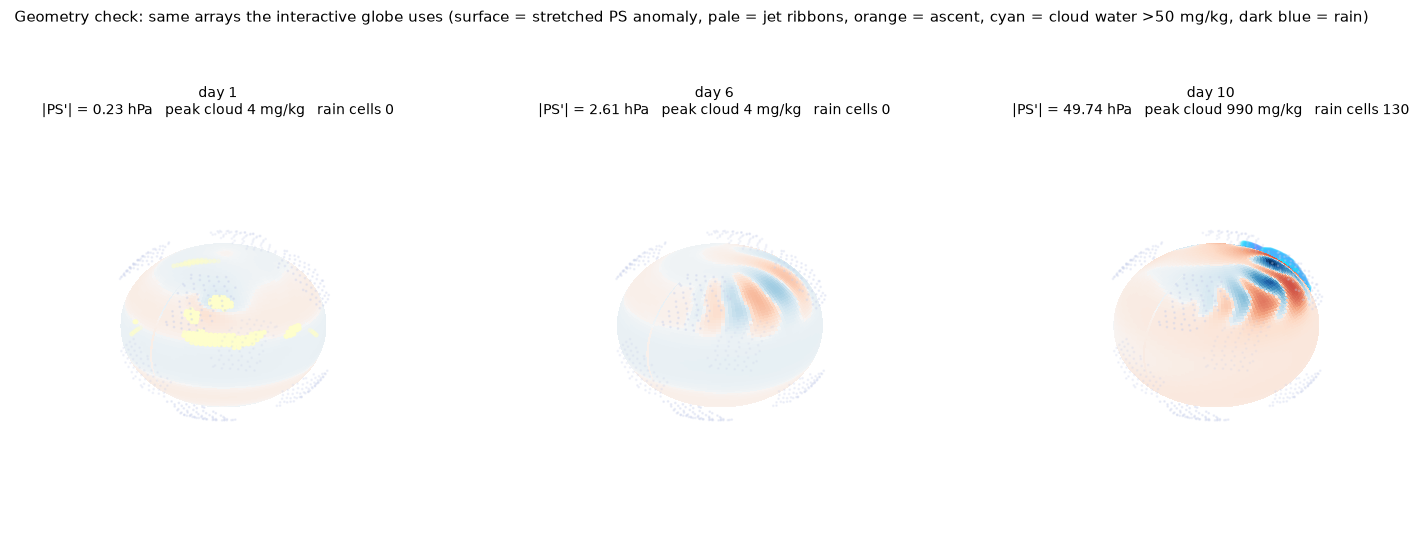
The record includes CSVs, a model history file, charts, a globe artifact and two original explanatory movies.
Where the conclusion stops
- 214× is atmospheric amplitude growth, not a computational speedup.
- Day 0 is an instantaneous state; daily averages begin later and should not be mixed into the same growth calculation.
- Peak rain near 55 mm/day is local; day-10 area-mean rain is about 0.0096 mm/day.
- No physical validation or conventional-workflow timing was supplied.
The next useful test
Test sensitivity to resolution and initial conditions, and validate the explanation against independent diagnostics.
Selected scientific files
These files support inspection of the study. They are not a complete package of run inputs, dependencies or raw outputs. Scientific scripts are provided for reading; this website does not execute them.
- baroclinic_explainer.py
- baroclinic_wave_explainer.mp4
- build_globe.py · public copy
- fkessler_day1_extra_diagnostics.csv
- fkessler_day1_field_stats.csv
- fkessler_day1_summary.png
- fkessler_growth_timeseries.png
- fkessler_physics_movie.mp4
- fkessler_wave_lifecycle_days0_10.csv
- globe_geometry_check.png
- render_movie.py
Public copy: internal compute identifiers and local environment paths were removed or generalized. Scientific values are retained. Paths may need adapting and some original run inputs are not included.
This is an editorial evidence summary of a recorded investigation, including later requests and review. The prompt animation is a presentation of saved work, not a live simulation. Human time saved was not measured.