Fire dynamics · evidence summary
Follow the flame, then check what is driving it.
A researcher wants to understand how terrain slope changes a vegetation fire. The prompt specifies FDS and an available compute cluster, but leaves the geometry, fuel representation, scenario design and analysis to the investigation. The practical research decision is which mechanism and conditions merit more detailed simulation or a controlled burn experiment.
The research prompt
Research prompt · edited for public presentation
Use FDS to predict a vegetation fire on sloped terrain.
Four slopes. Temperature and flow made visible.
FDS runs at 0°, 10°, 20°, and 30° produced fields, diagnostics, and comparison movies to investigate how terrain changes the fire.
Reference grass fuel and no wind. Steep scenarios also use longer fuel beds and shorter ignition; slope is not isolated alone. Absolute spread rates remain unvalidated.
The recorded investigation
Turn a slope question into runnable physical scenarios
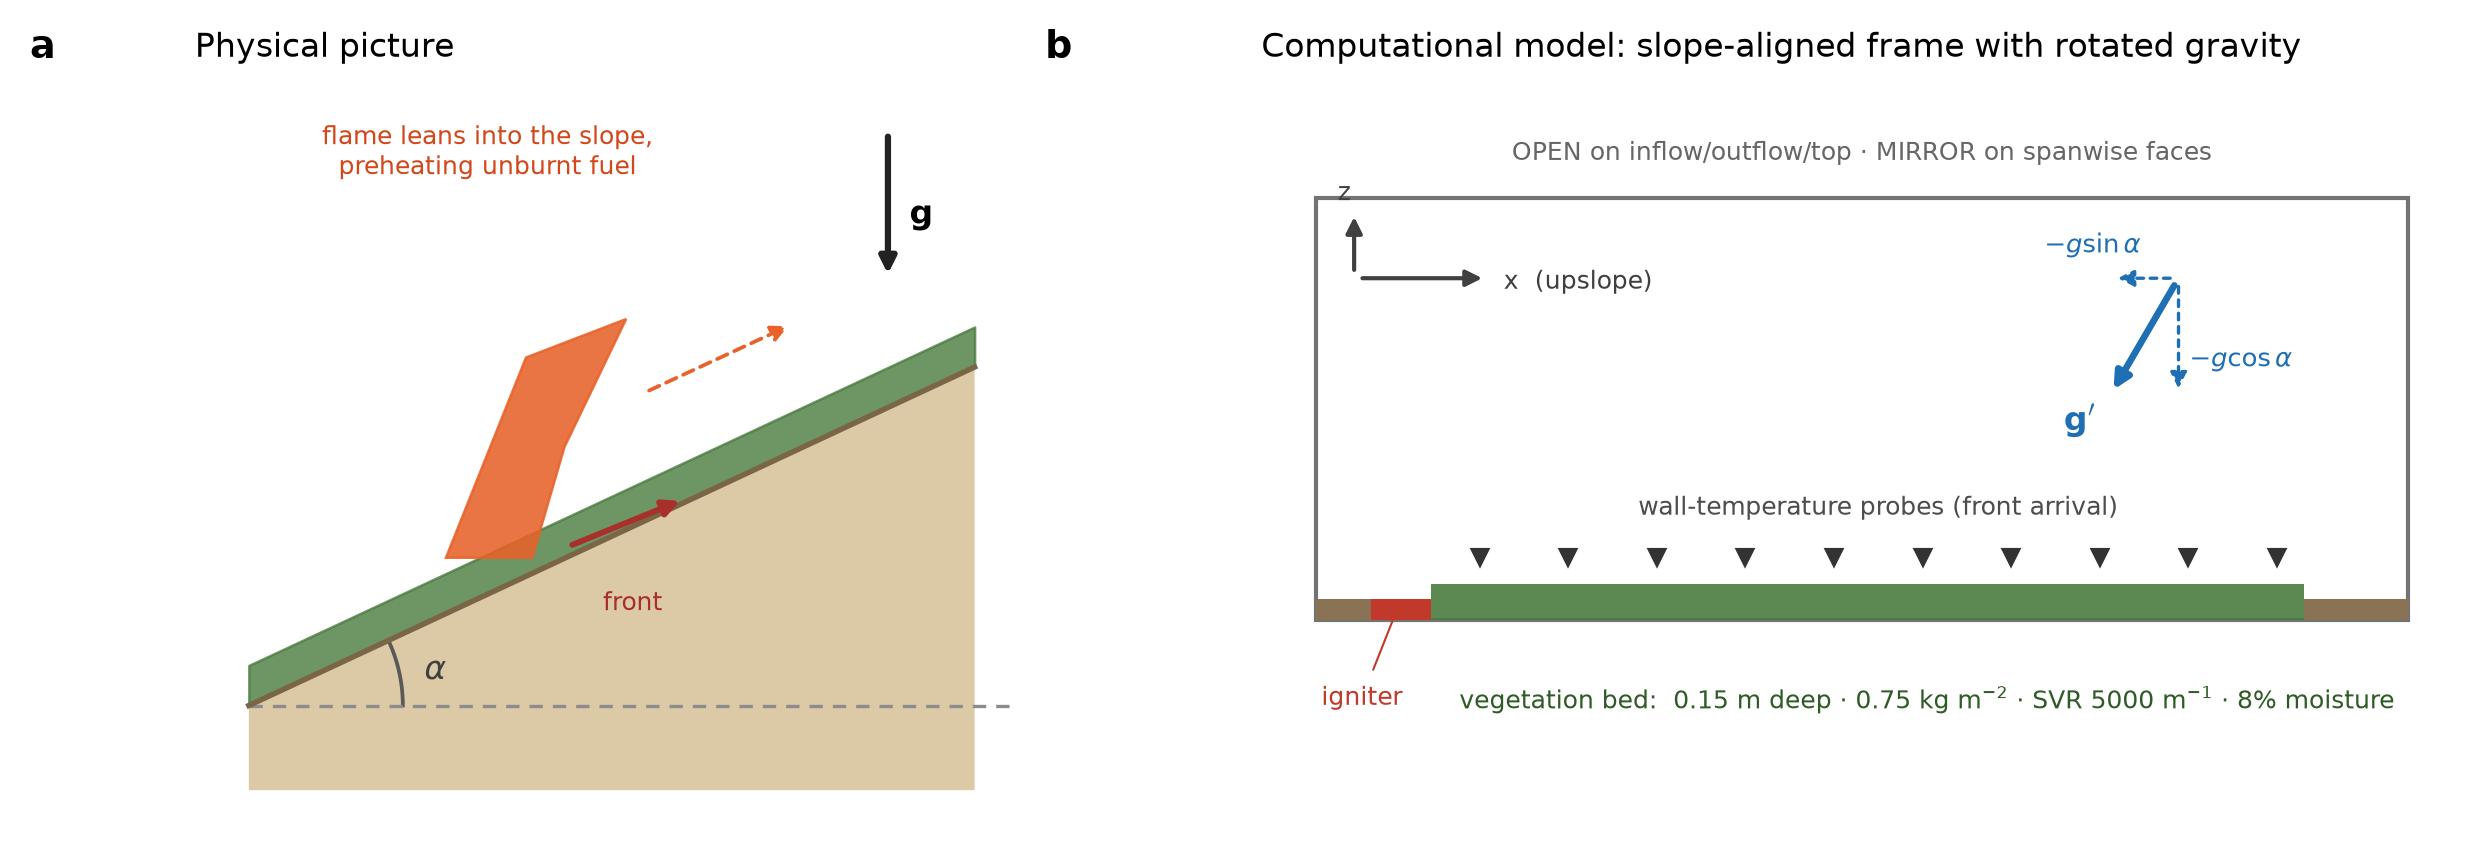
Laplace represented a planar slope by rotating gravity while keeping the fuel bed aligned with the computational grid. It used reference dry-grass properties, zero ambient wind and a 31.25 mm cell size. The final input decks contain 196,608 cells for shallow slopes and 491,520 for the longer steep-slope cases. The session also caught a cluster-launch problem: some launch commands exited successfully while FDS reported only one process. It checked the reported rank counts before proceeding.
Reject a plausible number when it answers the wrong question
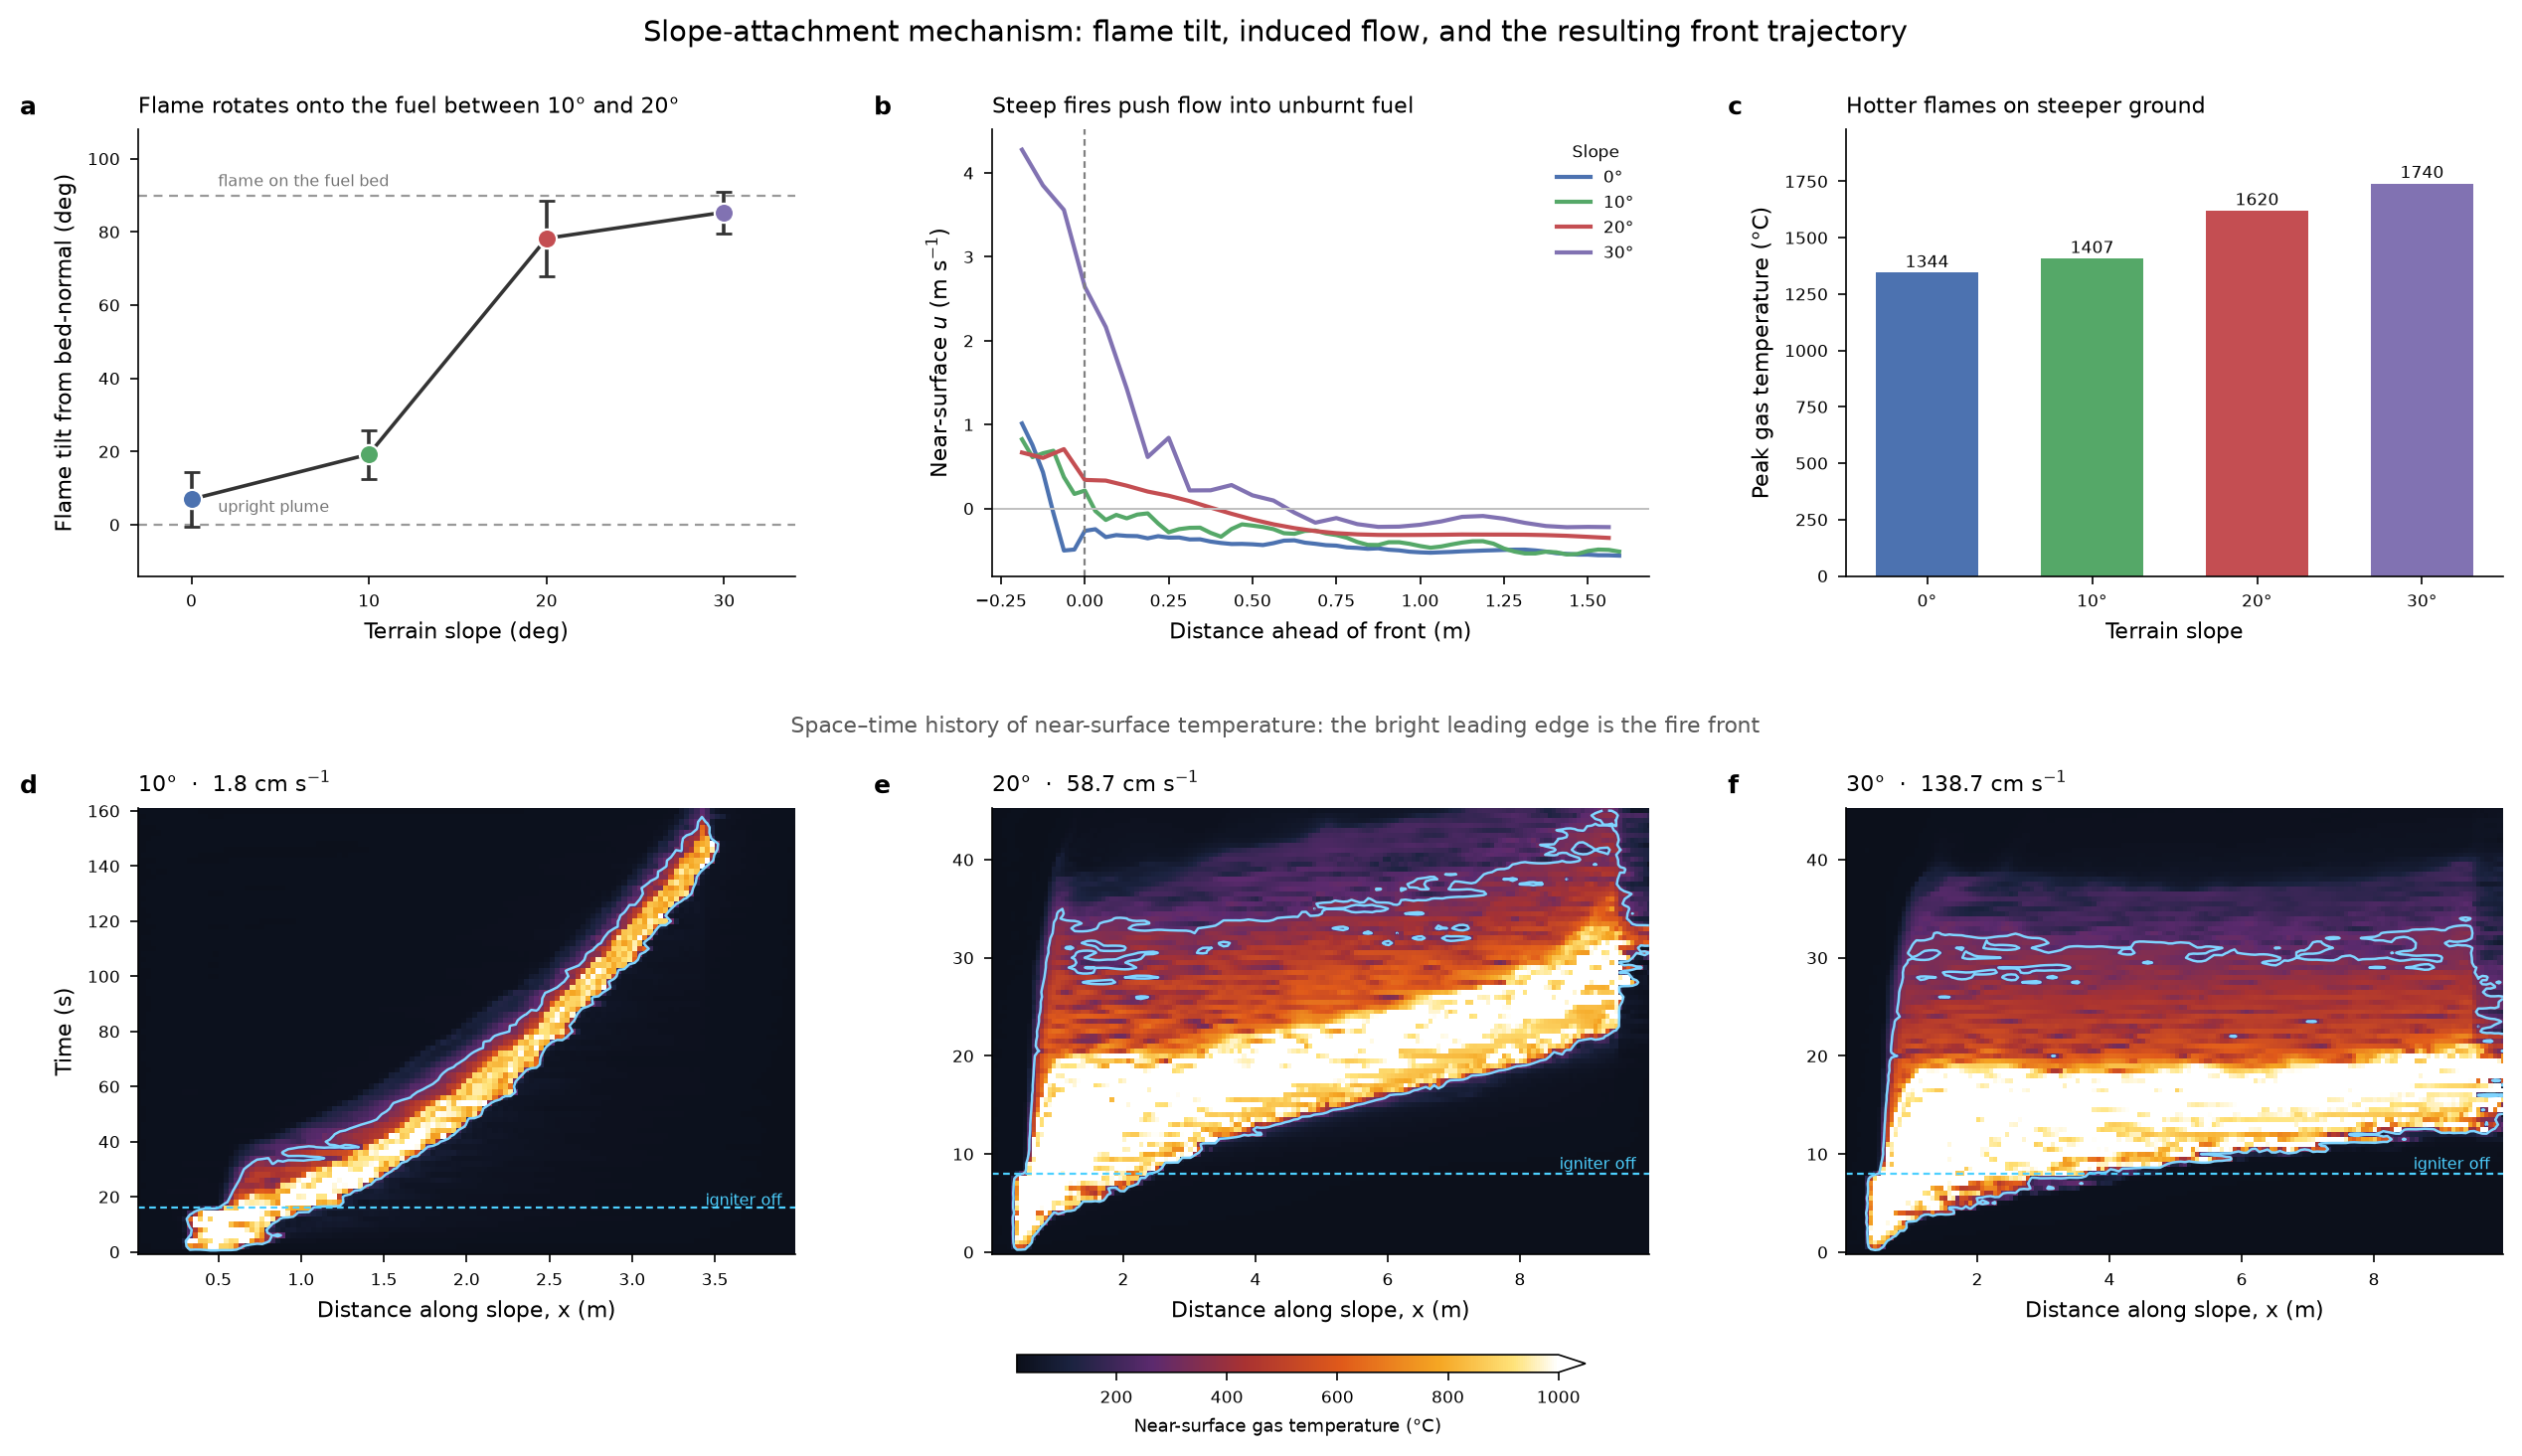
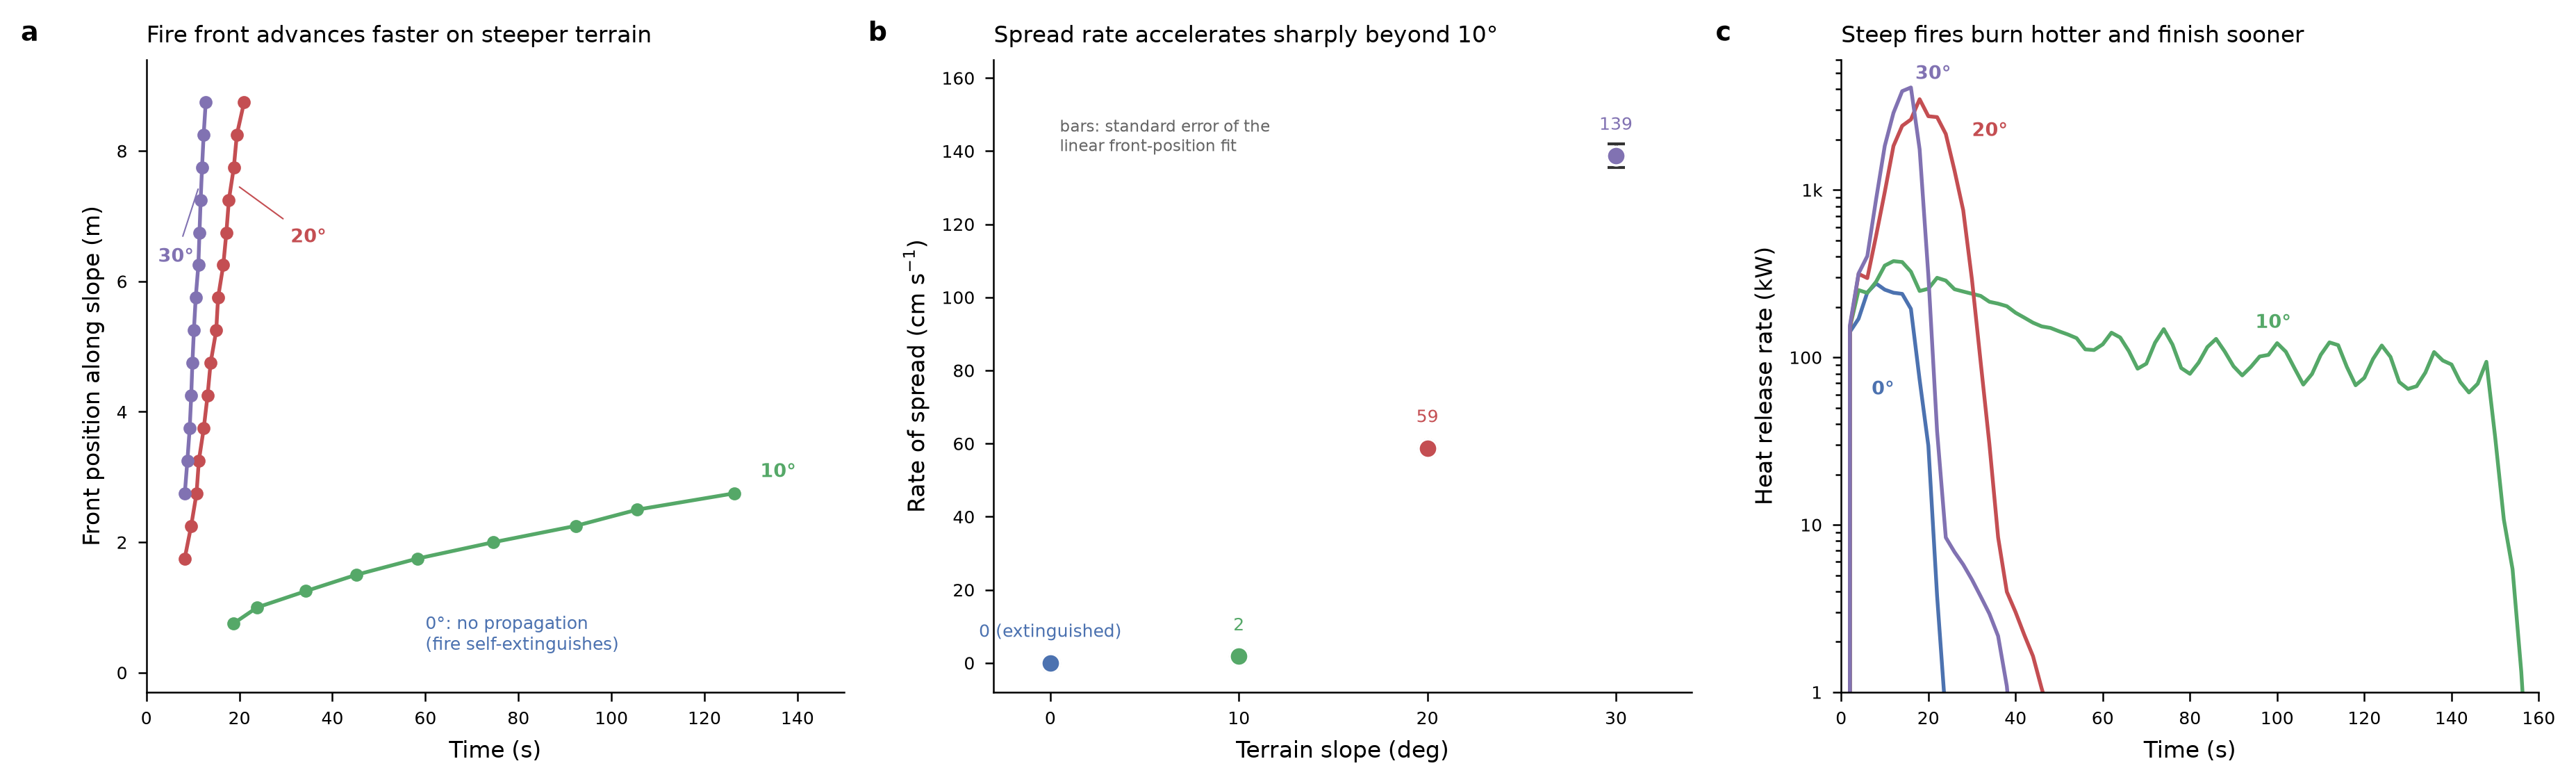
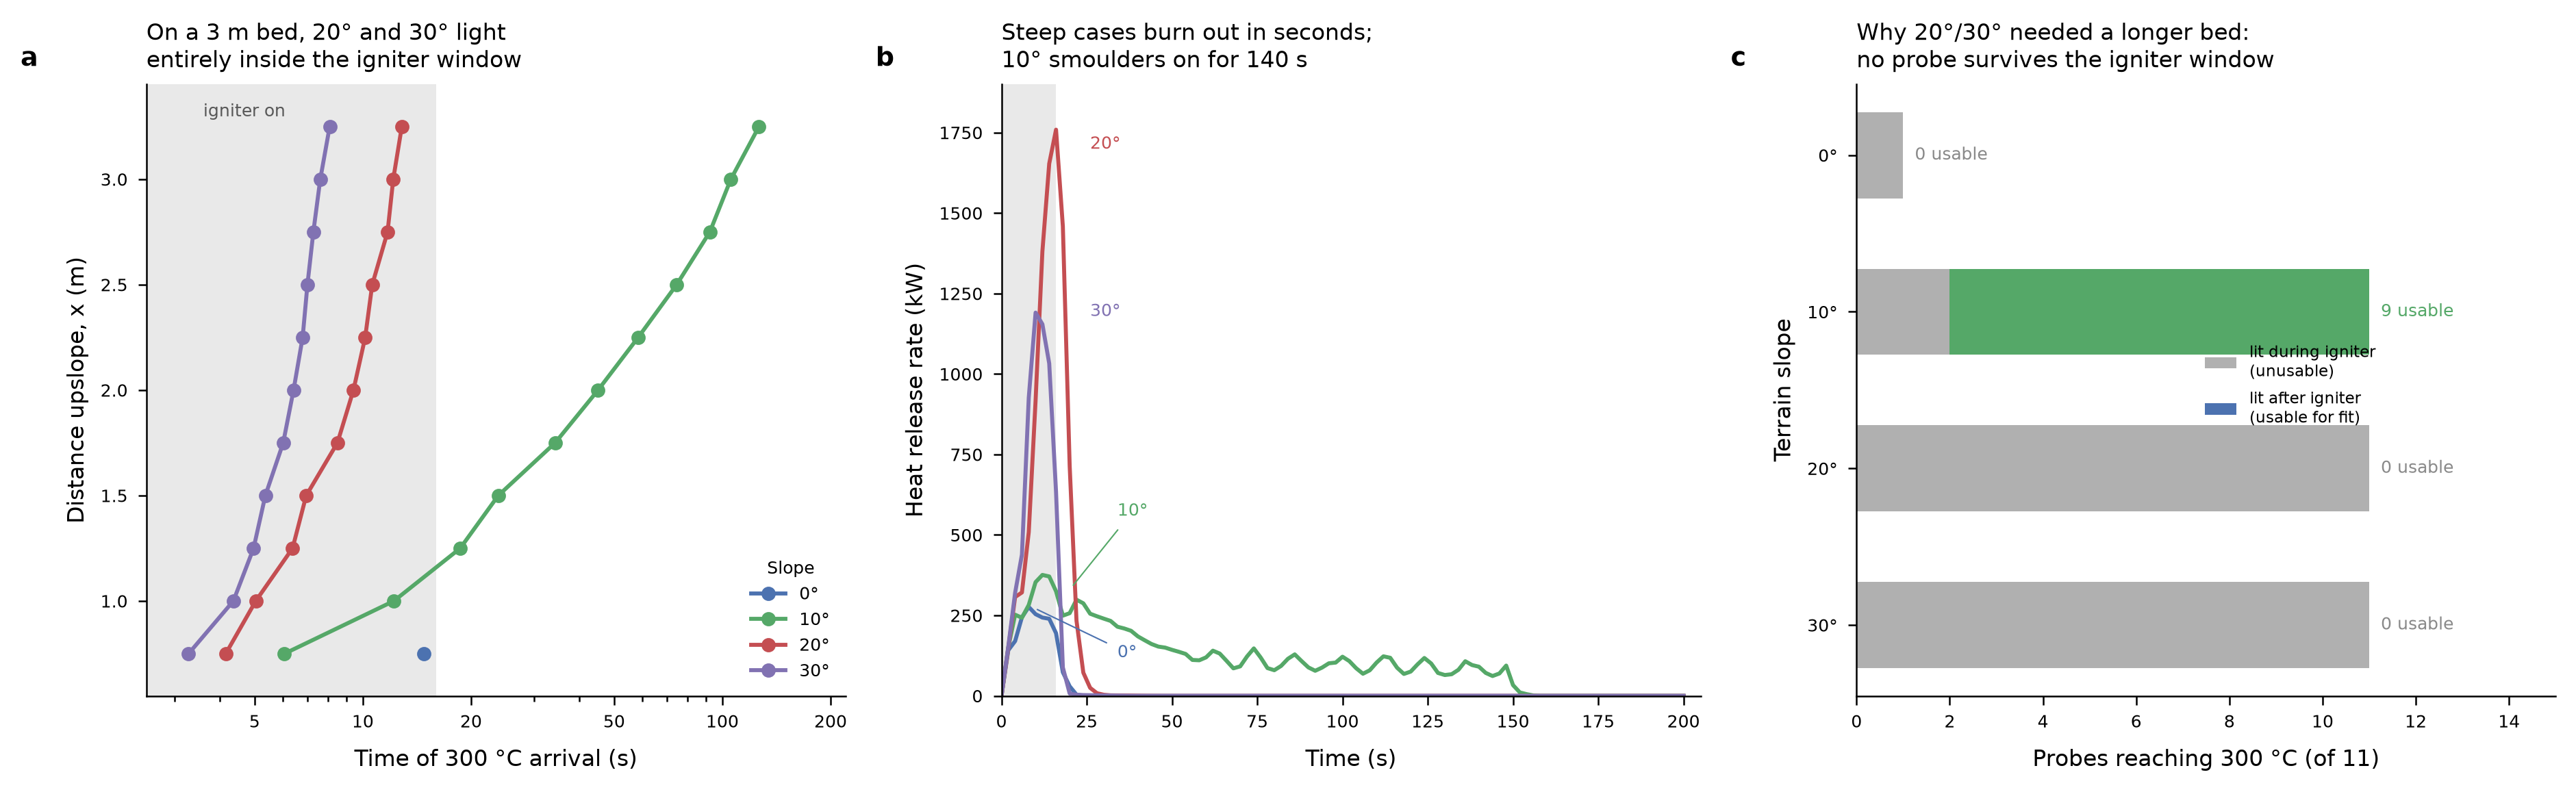
In the first steep-slope runs, the entire 3 m fuel bed ignited before the ignition source switched off. A tidy line fit could still be made, but it described the ignition setup rather than a front continuing on its own. Laplace reran 20° and 30° on 9 m beds with a shorter ignition period and fitted only arrivals after the igniter stopped. The final table reports no sustained propagation at 0°, then 1.79, 58.72 and 138.71 cm/s at increasing slopes. These remain configuration-dependent predictions.
Show the mechanism, then check the visualisation itself
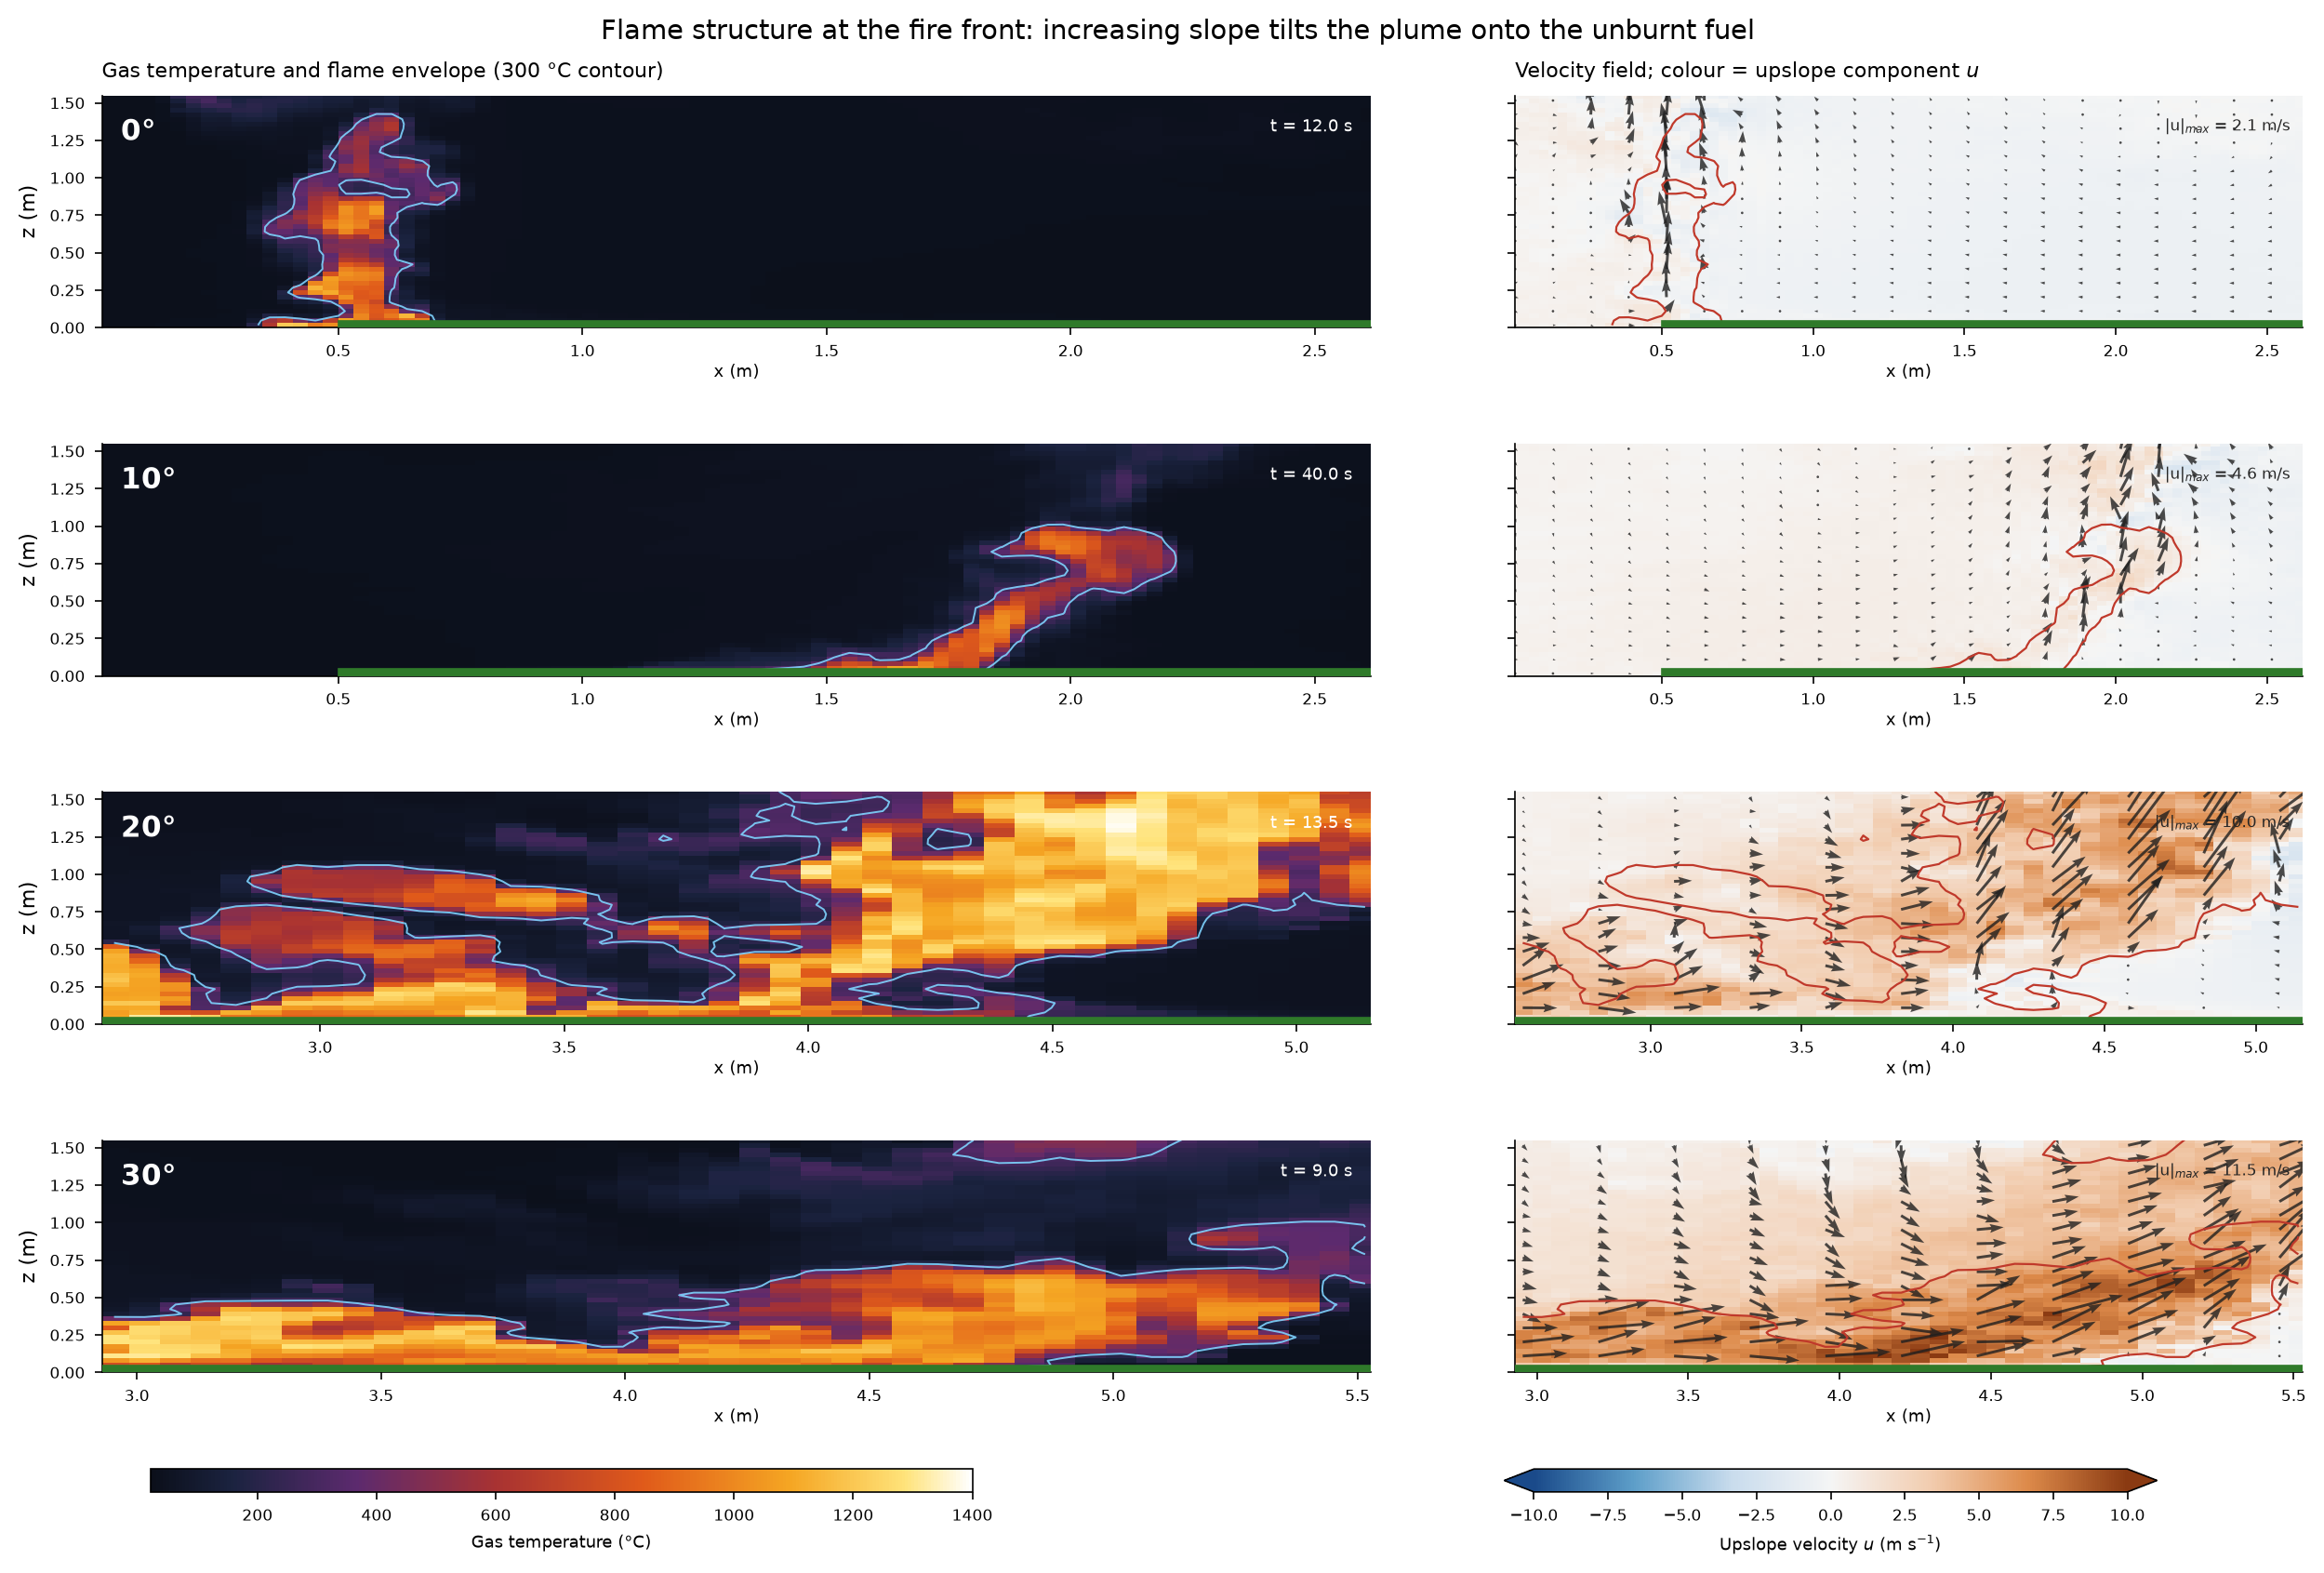
The resolved fields show an upright plume in the shallow cases and a flame lying closer to the fuel in the steep cases. A later request turned those fields into still images and landscape and portrait movies. Review found cold stripes introduced when neighbouring mesh slices were joined incorrectly, plus temperature peaks calculated from reduced-resolution data. The final response records corrections to the assembly code, full-resolution peak diagnostics and rebuilt MP4s. The supplied source movies and revised stills are featured here; this review has not reconstructed their raw fields.
Where the conclusion stops
- The fuel is an FDS reference grass set, with 8% moisture and no ambient wind. The geometry is a planar slope and an idealised narrow line-fire configuration with mirror side boundaries. This is not a site-specific wildfire or incident forecast.
- Only one grid resolution, 31.25 mm, was tested. No quantitative comparison with a physical fire experiment was performed. Absolute spread rates and the apparent transition between 10° and 20° remain unvalidated scenario results.
- The 0° and 10° cases use 3 m beds and 16-second ignition; 20° and 30° use 9 m beds and 8-second ignition. The change addresses ignition contamination, but the final matrix is not identical in all settings except slope. The steep cases remain domain-limited and accelerating.
- The ± values in the source table are standard errors of a fitted line, not total prediction uncertainty. A high fit score does not validate the model or remove ignition, fuel and resolution effects.
- The final MP4s and two field figures are identified in the session as corrected versions. Earlier GIFs predate the slice-assembly fix and are preserved in the archive rather than featured as corrected results.
- The supplied ZIP omits raw device histories, raw field files and corrected field arrays. Input decks and summaries can be inspected, but the spread fits, field reconstruction and claimed checksum checks cannot be independently reproduced from the supplied bundle alone.
- The technical-memorandum styling follows the user’s report-format request; it does not establish NASA or NIST authorship, review or endorsement of this study. Reported cluster runtime and core-hours do not establish total cost or human time saved.
The next useful test
Test sensitivity to grid size and fuel-bed length, then reproduce a controlled experiment with measured fuel properties. Only after that evidence should the model be extended to wind, realistic terrain or decisions that require predictive accuracy. The current study helps choose that next research step.
Selected scientific files
These files support inspection of the study. They are not a complete package of run inputs, dependencies or raw outputs. Scientific scripts are provided for reading; this website does not execute them.
- fds_configuration.png
- fds_field_diagnostics.csv
- fds_flame_structure.png
- fds_mechanism.png
- fds_ros_vs_slope.png
- fds_slope_movie.mp4
- fds_slope_movie_portrait.mp4
- fds_slope_results.csv
- fds_slope_summary.png
This is an editorial evidence summary of a recorded investigation, including later requests and review. The prompt animation is a presentation of saved work, not a live simulation. Human time saved was not measured.