Automatic control left less demand unmet on average in simulation.
A fictional energy company must keep electricity flowing while cyber disruptions and equipment failures affect its connected systems. Compare defensive responses to the same crisis and see when protecting one system makes the wider outage worse.
Watch the simulation ↓Compare four responses to identical simulated disturbances and test which system connections carry the resulting disruption.
A fictional two-region utility connected to a standard 39-node test power grid. All disturbances, service failures and responses are simulated; there is no calibration to a real company.
Explore the recorded comparison
Response choices sharply change the outcome of a selected severe simulated outage.
Three responses face the same outage. Watch electricity delivery change, then compare the wider set of scenarios.
Loading the reviewed dataset…
Explore the results Experiment settings, comparisons and evidence
This selected severe example favors coordination more strongly than the wider evaluation. No operator action still includes automatic grid controls and scheduled changes to generation. The main cascade begins before the injected cyber disruption.
Simulation campaign
We compared response strategies across varied utility disruptions.
The simulation connects power equipment to the services and decisions around it. It checks valid starting conditions, compares responses to the same disturbances, and uses the event sequence to challenge the first explanation.
Connected components link physical equipment to utility services.
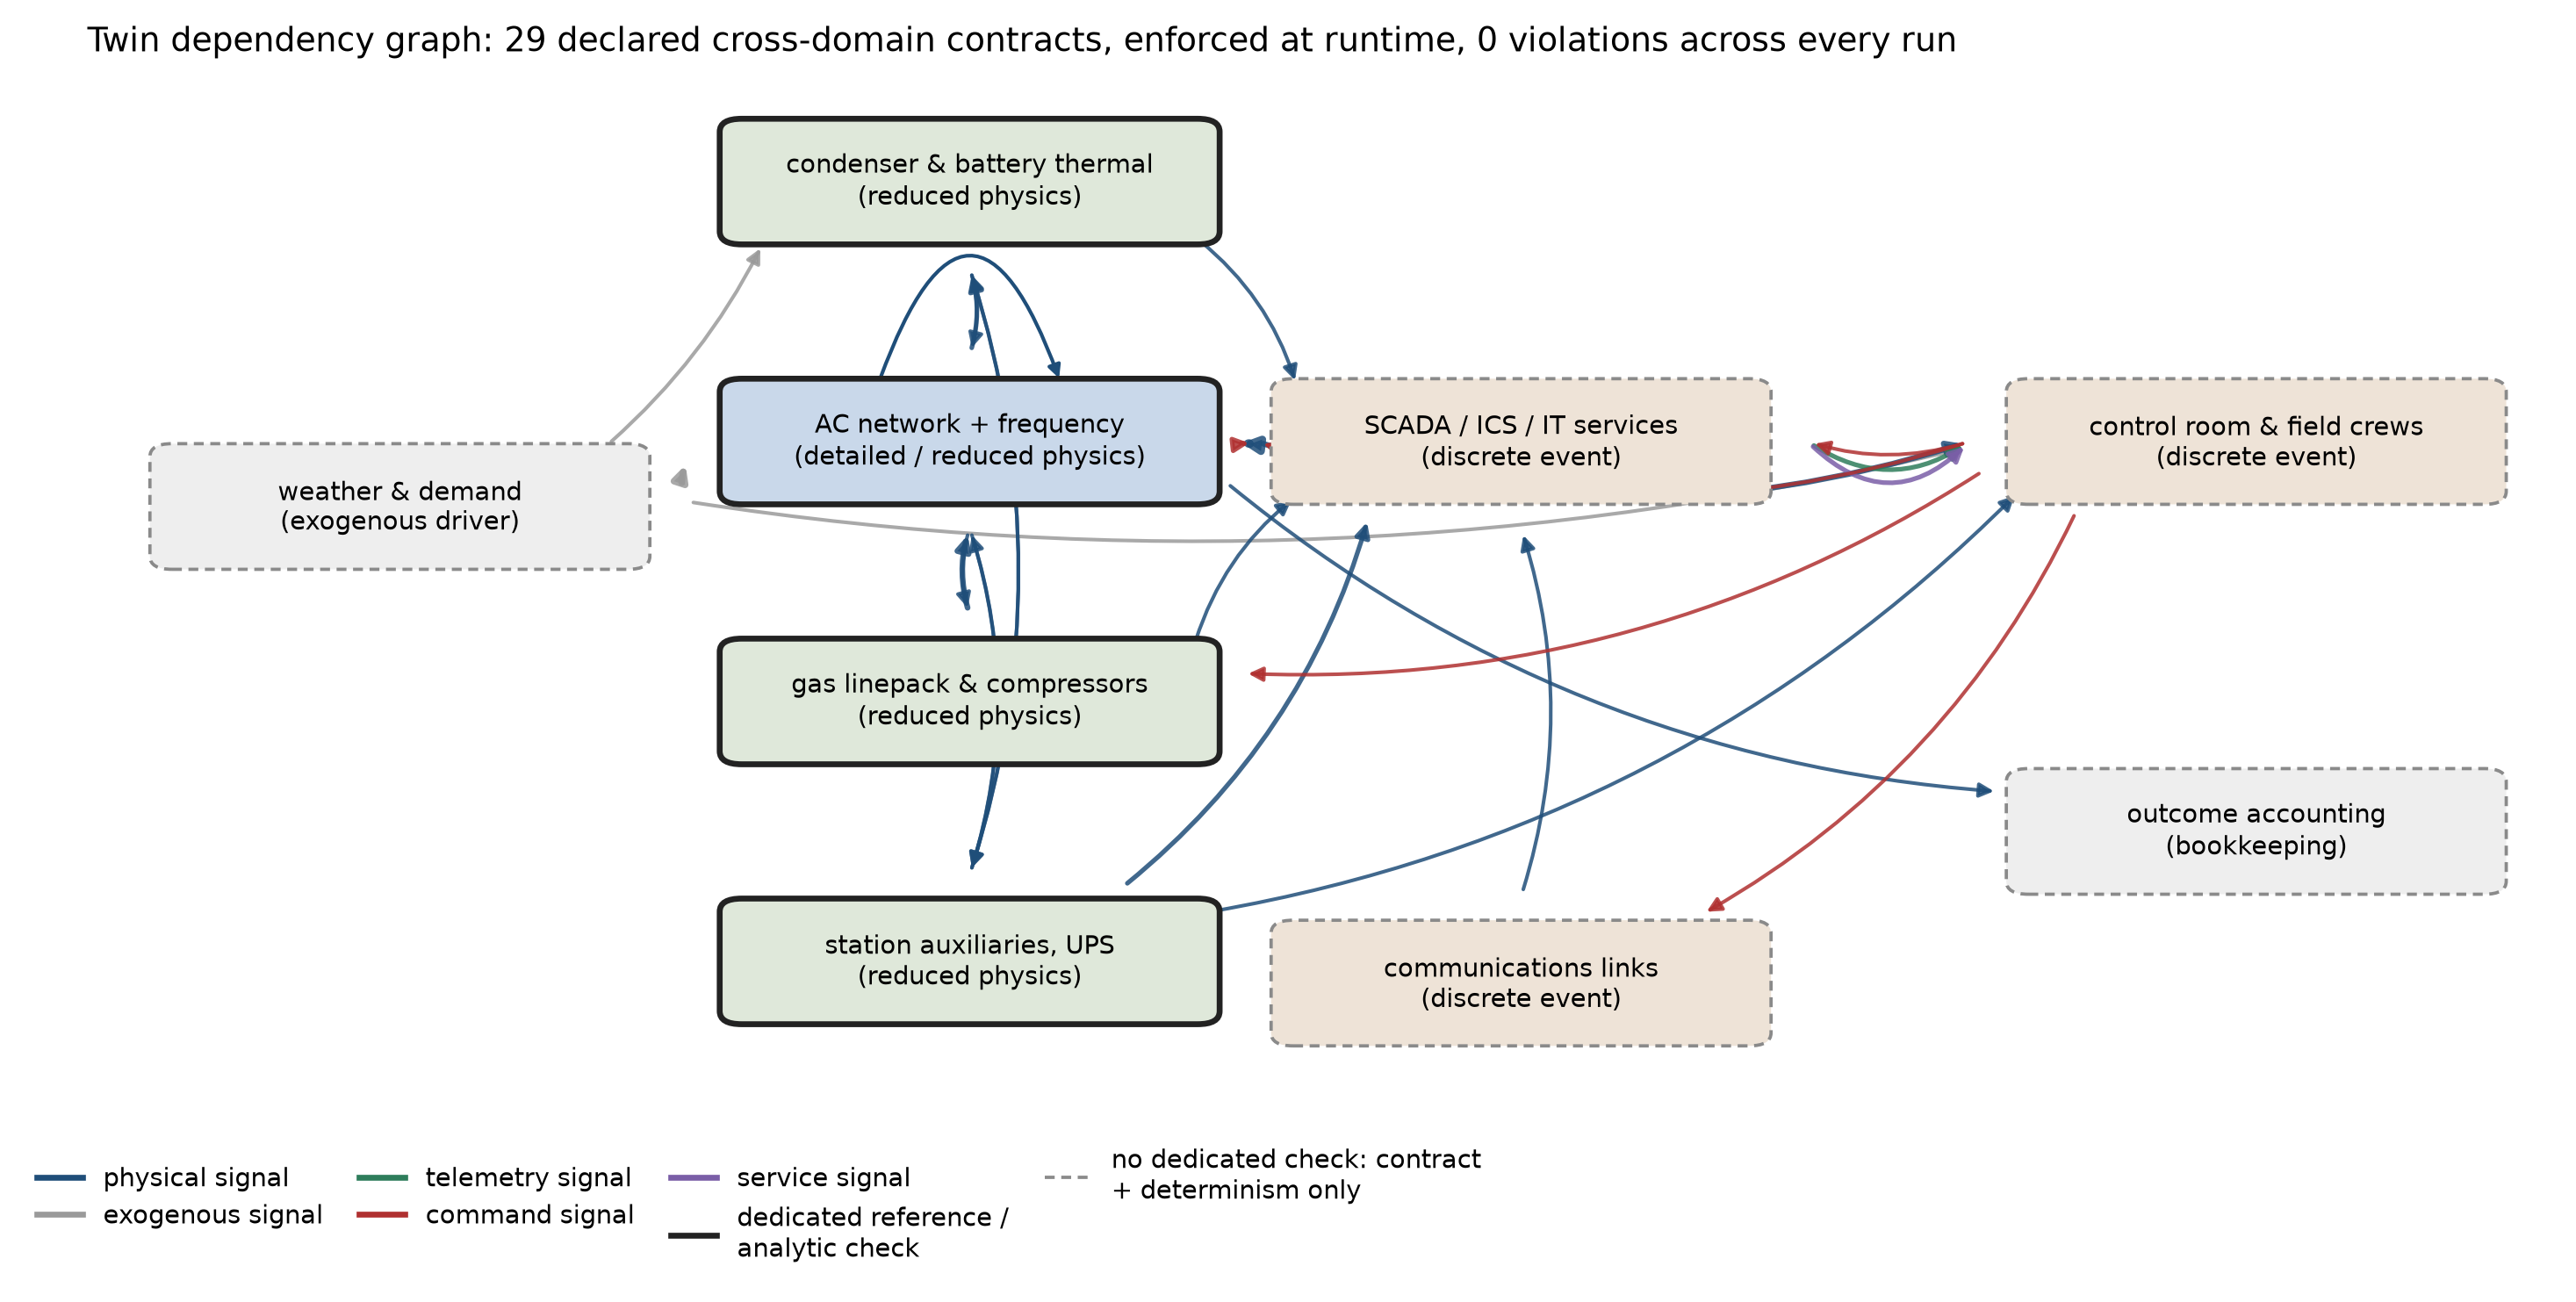
Twelve linked components represent electricity, cooling, gas, communications, digital services, crews and response decisions. Twenty-nine defined connections describe how disruption can move between them.
Component map and dependency definitionsInvalid starting conditions are removed from the comparison.
Selected calculations are checked against reference results. Scenarios without a valid starting generation plan are removed before response performance is compared.
Numerical checks and starting-condition correctionResponse strategies face identical disturbances over the same simulated interval.
Four response strategies face the same conditions in scenarios reserved for evaluation. Of 5,000 scenarios, 4,948 have valid starting conditions and enter the six-hour comparison.
Matched evaluation resultsEvent timing and connection removal test the proposed failure mechanism.
The detailed replay shows when equipment trips, operators act and cyber effects begin. Additional runs remove individual connections to test which ones actually affect the outcome.
Recorded event sequence and connection-removal testsSee the scale and model detail +
Four responses share each scenario’s disturbances over six simulated hours. Fifty-two of the 5,000 sampled scenarios lack a valid starting condition and are removed.
The components have different levels of detail. Six lack their own dedicated external or mathematical reference check.
These describe modeled dependencies. Their presence does not mean every connection has been independently validated or tested in every scenario.
The simulation connects a power grid with 39 nodes and 46 links to equipment, service and response models. Automatic power control, scheduled generation changes and operator decisions run at different intervals. Twenty-three supplied checks cover specific calculations, connections and repeatability; they do not validate every component or a real utility.
The outcome
Automatic control left less demand unmet than coordinated responses on average.
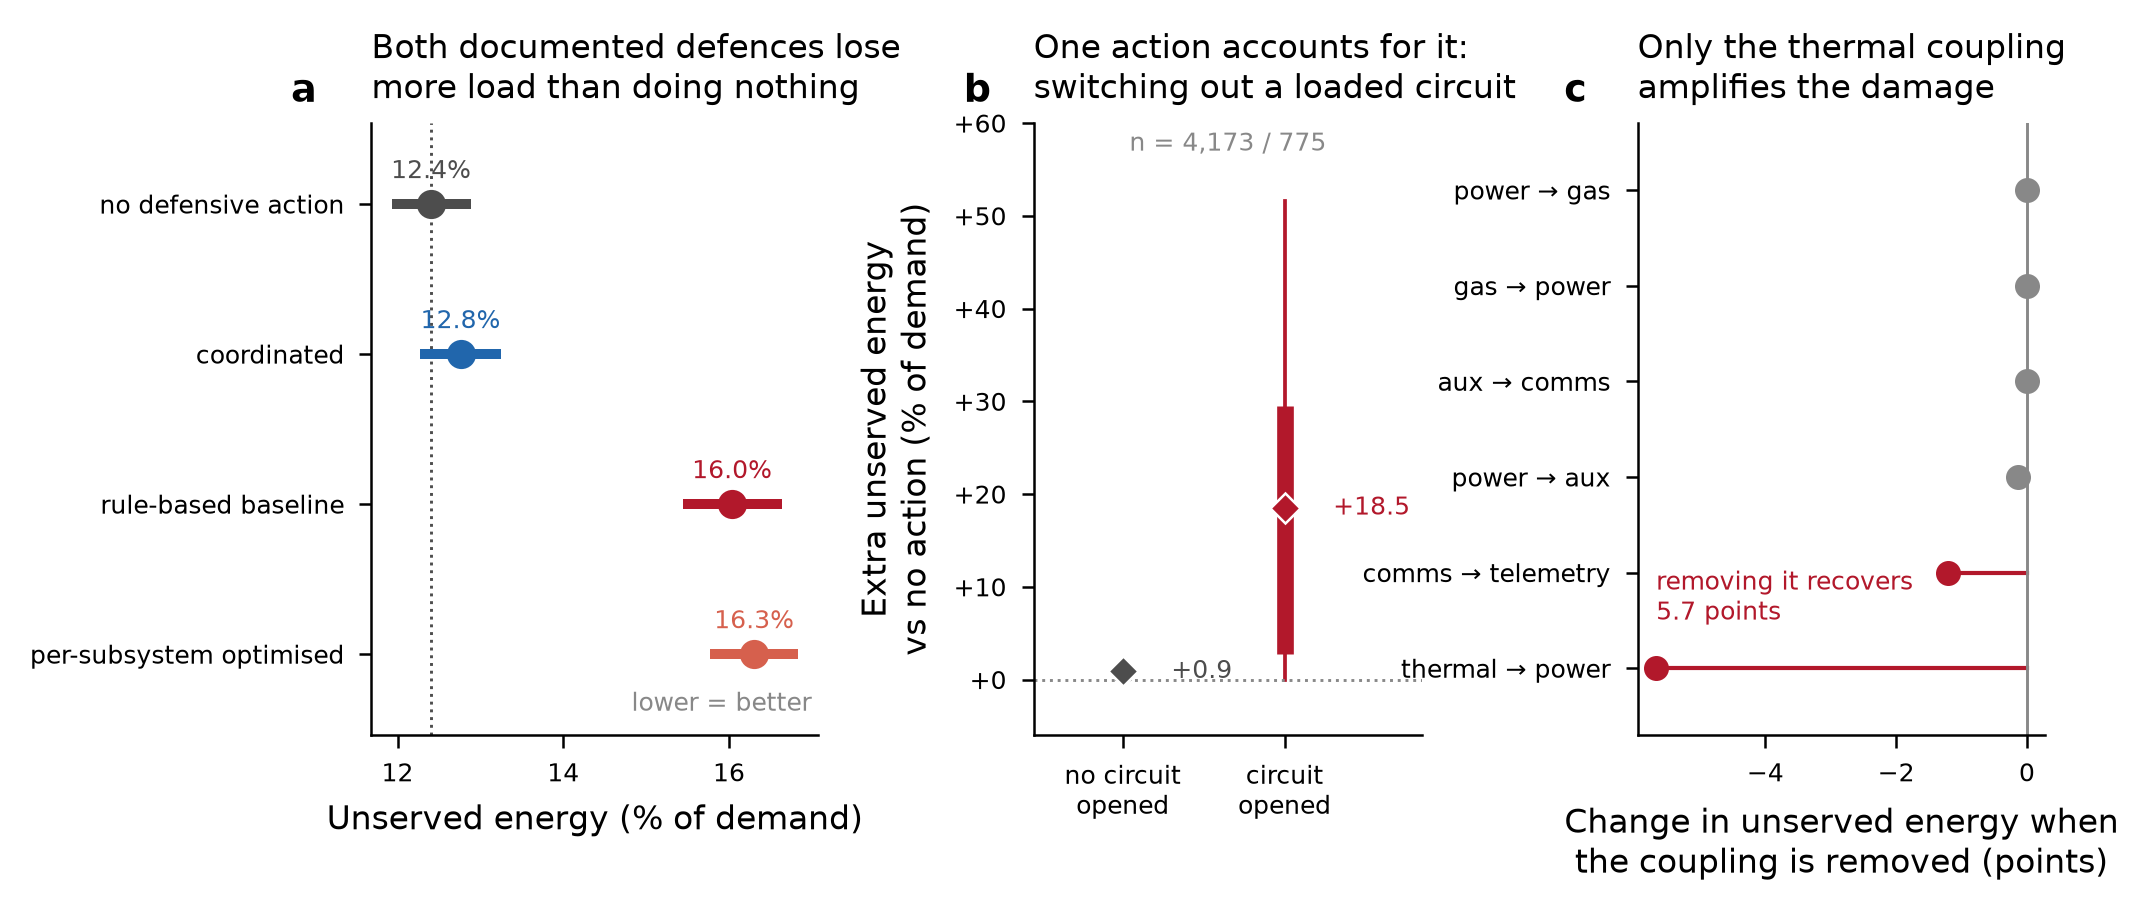
Across the 4,948 evaluation scenarios, the rule-based response leaves an average 16.04% of energy demand unmet. Coordination reduces that to 12.76%. With no operator action, the mean is lower still at 12.41%. The dramatic replay shows a possible failure path, not a typical benefit or a recommended operating policy.
Coordination sharply reduces unmet demand in the selected severe replay.
In the replay, unmet energy demand is 91.01% with the rule-based response, 10.13% with coordination and 12.67% without operator action. These are three versions of one selected scenario, not averages across the evaluation.
Coordination does not beat the automatic-response control.
Coordination improves the rule-based response but leaves about 0.36 percentage points more demand unmet than no operator action. The supplied uncertainty range for that difference is +0.19 to +0.51 points. Automatic grid response remains active in the control.
Removing heat’s effect on power production reduces loss in the test subset.
In 250 selected severe development scenarios, removing either gas-to-electricity connection has no effect on mean loss. Removing the effect of heat on power production reduces loss by 5.67 percentage points. These tests concern that selected subset, not all evaluation scenarios.
Event-timing correction
The outage is already cascading before the cyber disruption.
Initial causal interpretationThe dramatic replay could suggest that a cyber event caused the outage and that coordination demonstrated a cyber-resilience gain.
Recorded event orderThe extra switching command comes about 46 seconds after the equipment trip, but about 2.75 hours before the first injected cyber effect. The main cascade is already underway.
The replay compares response strategies under combined stress. Several actions change together, so it cannot isolate one command or establish that cyber effects caused the principal outage.
Implication for response evaluation
Response strategies need evaluation across many outages.
A response can protect one asset while adding stress elsewhere. Replaying matched scenarios makes that trade-off visible. Comparing the selected incident with the wider evaluation prevents a striking animation from becoming the whole argument.
Response choices change disruption across the fictional utility
Within this fictional utility, response choices change system-wide disruption. Matched runs and connection-removal tests reveal a modeled failure path and narrow an initially overbroad causal explanation.
Real utility behavior and cyber-caused outages remain unproven
- No measured utility data or field calibration is supplied. Several components lack dedicated external or mathematical reference checks.
- The principal cascade begins before the first injected cyber effect. This replay does not establish that a cyber attack caused the outage.
- No operator action is a comparison condition, not operating advice. Automatic frequency control and five-minute generation scheduling remain active.
- The animation shows a selected severe scenario. Across 4,948 evaluation scenarios, coordination does not beat the mean result with no operator action.
- The connection-removal tests use 250 selected severe development scenarios. Their effect sizes do not describe the wider evaluation population.
- Passing specific checks does not establish real utility behavior. Injected cyber effects are simulated disruptions, not a model of an attacker breaking into a network.
The evidence
The original figures separate system dependencies from response outcomes.
Unaltered supplied figures, with the model scope and final corrections kept beside them.
Read the source and interpretation notes +
Download the reviewed evidence notes ↓ · Download the displayed data ↓
Related simulations
Related simulations compare robotic fingers and reactor fault evidence.
Robotics · touch and control
Robotic finger design simulation
Simulate robotic fingers before fabrication. Compare skins, touch sensors and controllers across manipulation tasks.
Explore the simulationEnergy · finding the cause of a fault
Reactor fault diagnosis simulation
Create hidden reactor faults with similar readings, then test whether an intervention, a longer wait or another measurement reveals the cause.
Explore the simulation