Robotic finger simulations narrow the designs for physical testing.
Before building a robotic finger, compare its skin, touch sensors and controller together. This simulation tests candidate designs across manipulation tasks and predicts which versions are worth fabricating.
Watch the simulation ↓Compare skin, touch sensors and control across four manipulation tasks to select designs for physical testing.
A replay of saved simulation results. Task scores describe the simulated environment; no fabricated finger was measured or tested.
Explore the recorded comparison
Different skins change the contact signals available to a controller.
Press a simulated skin and watch contact and force change. Compare materials, then explore the proposed designs below.
Loading the reviewed dataset…
Explore the results Experiment settings, comparisons and evidence
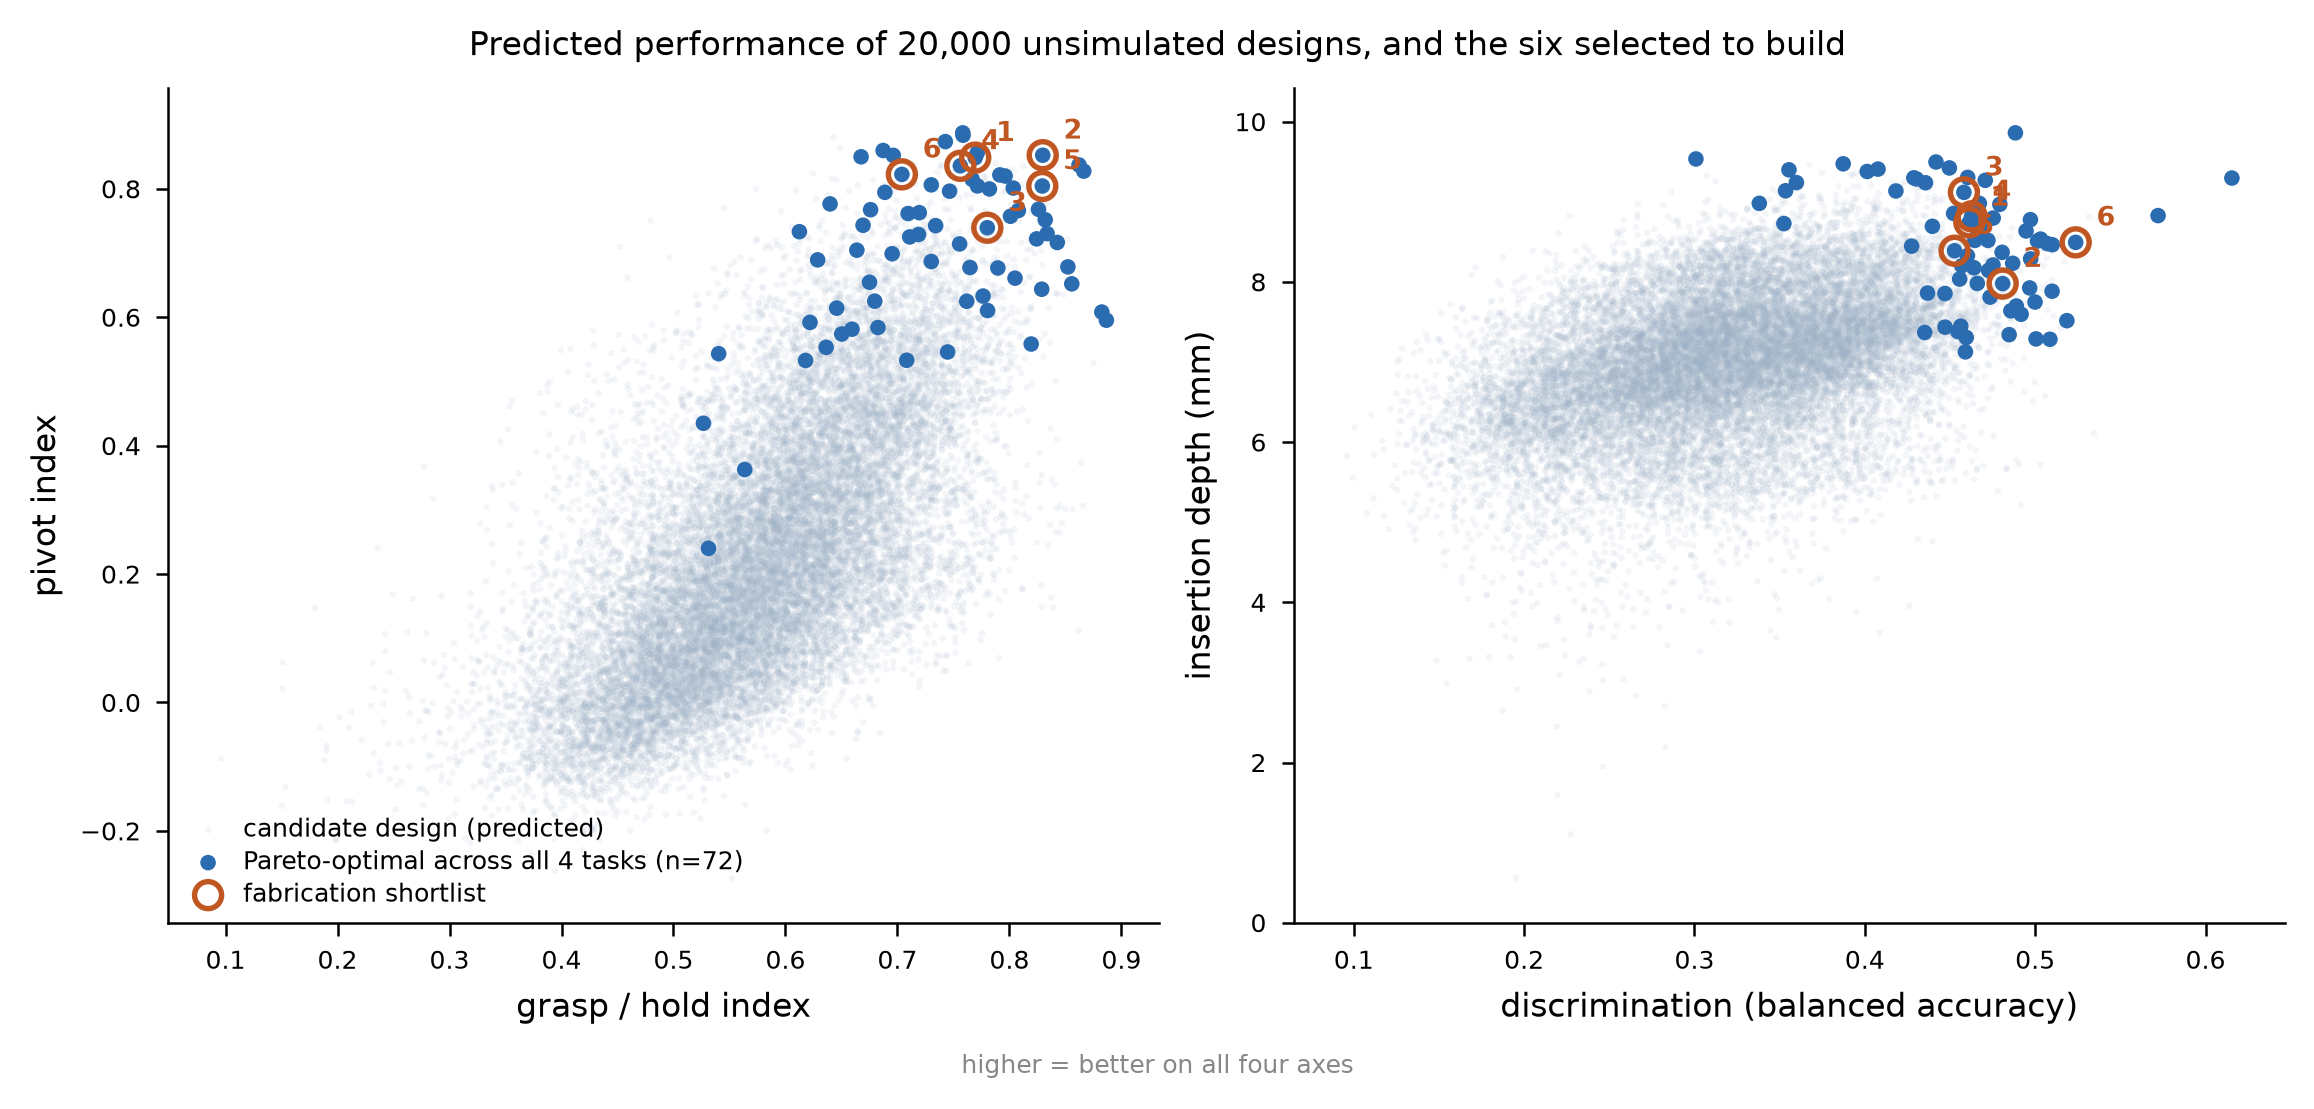
The animation steps through recorded indentation levels, not elapsed physical time. Its colored field shows how a small point load would affect strain beneath the skin, not a moving deformation mesh. The design chart shows 200 directly simulated candidates, 72 promising predicted trade-offs and six proposed prototypes. Predictions have not been physically tested.
Simulation campaign
We compared skin, sensors and control before selecting prototype designs.
Skin changes how contact reaches a sensor. Sensors change what a controller can observe. The simulation connects those effects, compares many designs, and checks whether an apparent improvement comes from the hardware or from how its controller was trained.
Skin and backing determine simulated sensor responses.
Simulated layers of soft skin and backing turn an applied load into contact forces and sensor responses. One skin calculation can support eight combinations of sensors and control settings.
Skin-contact calculations and interface definitionEach design learns manipulation tasks with its own sensors.
Each design practices grasping, turning, recognizing textures and insertion. Its controller receives signals from that design’s sensors, including their placement and noise. Three repeated training runs help reveal variation.
Candidate training and four-task evaluationUnseen skin designs test the model’s screening ability.
A prediction model learns from the completed runs. It is checked on whole skin designs kept out of training, then used to screen more possibilities and propose a set of prototypes.
Prediction checks and corrected design shortlistTraining budgets reverse the apparent sensor-speed advantage.
Slower sensors initially appear better. Changing the amount of practice reverses that result. The final analysis removes this unresolved comparison and recalculates the proposed designs.
Controlled training-budget comparisonSee the scale and model detail +
The supplied results cover 515 skin designs. Twelve candidates have an undefined grasp score and are omitted from the displayed sample rather than treated as successful results.
A model predicts four-task performance for 20,000 additional designs. Seventy-two are not beaten on every task by another predicted design. These are predictions, not physical tests.
Their predicted performance overlaps substantially. They form a set to test, rather than a reliable ranking from first to sixth.
The main comparison combines 512 skin designs with eight sensor-and-control variants, plus three reference fingers. Each candidate is trained three times across four tasks. Contact calculations vary indentation, object curvature and depth beneath the skin. The prediction checks show useful but limited screening ability. They were reported by the source simulation and were not independently repeated for this page.
The outcome
Proposed prototypes need a physical test of the skin recommendation.
The model points toward thicker, nearly smooth outer skins and controllers that know the finger’s position as well as what it feels. It does not identify one proven winner. The strongest skin recommendation depends on a major approximation: ridges are simulated as rings rather than parallel lines.
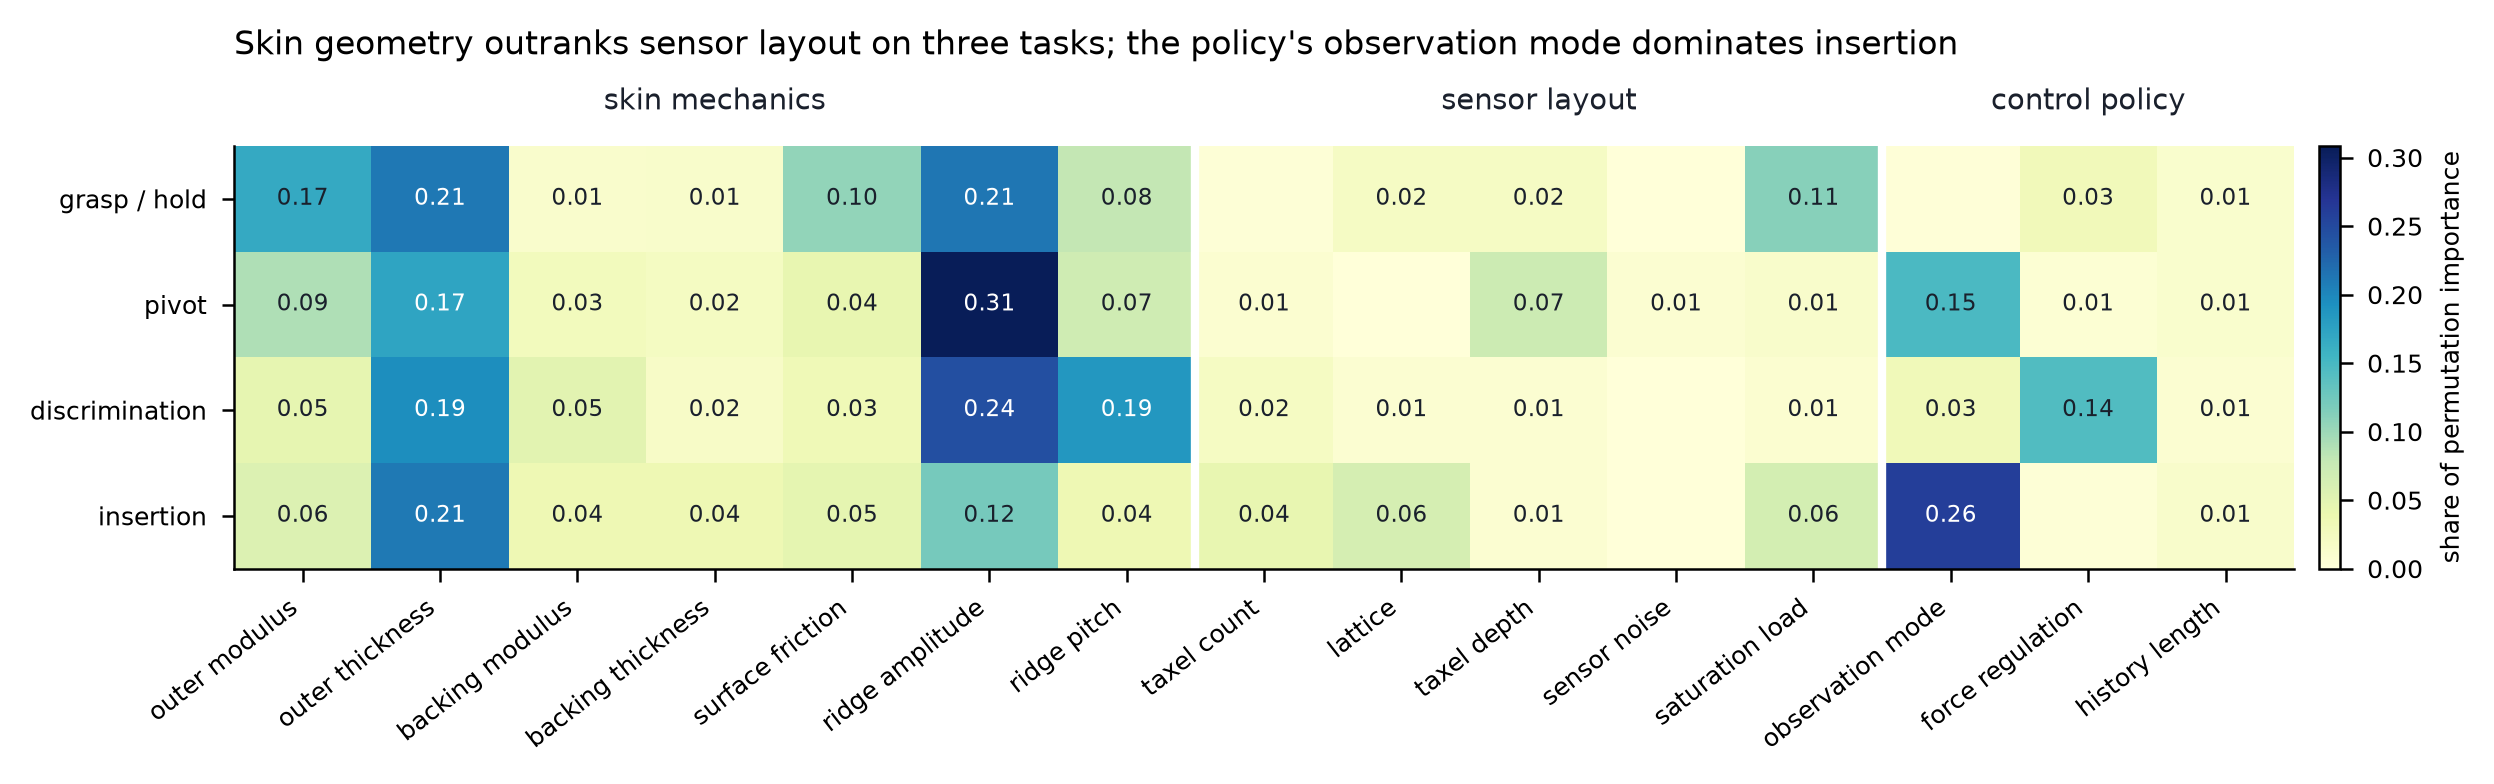
Skin geometry leads grasping, turning and texture rankings; position information leads insertion.
Skin thickness and ridge height lead the prediction model’s rankings for grasping, turning and texture recognition. For insertion, giving the controller finger-position information matters most. No single hardware choice explains every task.
Sensor count is a weak predictor within this simulation.
The proposed designs range from 9 to 49 touch sensors. Sensor count is a weak predictor in this simulation. That does not prove denser sensing is unhelpful: placement and other choices also vary, and there are no hardware measurements.
Matched smooth and ridged skins would test the main recommendation.
Two otherwise matched skins would directly challenge the model’s main recommendation. The simulation makes that physical experiment worth doing; it does not replace the measurement.
Training-budget correction
The controller’s practice changed the sensor ranking.
Equal training roundsSlower sensors appeared to improve insertion when every controller received the same number of training rounds.
Equal complete practice attemptsGiving every controller the same number of complete practice attempts reversed the trend. Neither approach fairly isolates sensor speed, so the final result makes no recommendation about it.
Faster sensing creates more steps within each practice attempt. Equal training rounds therefore provide unequal experience. The 48-run check changed the analysis instead of turning a training artifact into hardware advice.
Implication for prototype testing
A matched skin experiment can test the strongest design recommendation.
Building every possible finger is impractical. A simulation can narrow the choices and identify which physical test would most strongly challenge its recommendations. Here, it produces six candidates and a clear question about skin geometry, while keeping the uncertain conclusions visible.
A corrected prototype set and a testable skin hypothesis
A working simulation process connects skin contact, sensor signals, learned control and design comparison. It produces a corrected prototype set and a testable hypothesis about the skin.
Prototype performance and skin geometry still need physical validation
- No fabricated finger was measured. The reference designs are examples, not calibrated copies of real hardware.
- The skin-ridge calculation uses concentric rings. How much that differs from real parallel ridges was not established.
- Roughly 25–40% of the contact-table entries are extended from other results rather than successfully solved. Some sensor-response calculations and material-rate inputs are provisional.
- Controller training was limited. Sensor-speed effects remain entangled with training time, and sensor-count rankings do not establish a general rule about sensing density.
- Twelve undefined grasp results were treated as zero only when fitting the prediction model. The displayed sample omits them and does not hide them as valid scores.
- The proposed designs are uncertain predictions. The contact animation replays three separate reference skins and does not show a new physics calculation for each proposed prototype.
The evidence
The original figures show predicted trade-offs and the design choices behind them.
Unaltered supplied figures, with the model scope and final corrections kept beside them.
Read the source and interpretation notes +
Download the reviewed evidence notes ↓ · Download the displayed data ↓
Related simulations
Related simulations compare utility responses and reactor fault evidence.
Energy · connected-system resilience
Large-scale cyberattack simulation
Simulate cyber disruption and physical failures at a fictional energy company. Compare how defensive responses affect electricity delivery and business operations.
Explore the simulationEnergy · finding the cause of a fault
Reactor fault diagnosis simulation
Create hidden reactor faults with similar readings, then test whether an intervention, a longer wait or another measurement reveals the cause.
Explore the simulation