Reactor diagnoses can fail when plant assumptions change.
The campaign compared acting, waiting and adding measurements to diagnose simulated reactor faults. Changing the plant model or leaving fault combinations out of the diagnosis exposed recommendations that no longer worked.
Watch the simulation ↓Test whether an intervention, more observation time or an added measurement can distinguish faults, then repeat the evaluation under different plant assumptions.
A simulation-based test of diagnosis using two simplified reactor models. It is separate from the smaller fault-comparison simulation in this Research Hub; their scenario counts describe different work.
Explore the recorded comparison
The same readings can hide different reactor faults.
Compare instrument readings with the known simulated state. Then change the diagnostic evaluation to see where its conclusions fail.
Loading the reviewed dataset…
Explore the results Experiment settings, comparisons and evidence
The accuracy values come from an idealized statistical diagnostic method with access to the listed possible faults, not a trained AI or operator. Changing the scoring assumptions does not change the replayed physical traces. “Unresolved” means the tested actions and measurements were insufficient; no separate policy for declining to answer was evaluated.
Simulation campaign
We tested diagnosis across faults, sensors and reactor models.
We generated fault scenarios, compared ways to gather evidence, and challenged the conclusions with changed plant parameters, a separately written simulator and unlisted fault combinations.
Separate simulators tested dependence on the plant model.
The campaign used a reactor-system simulation and a separately written simulator with a different physical representation. A diagnostic conclusion could then be tested beyond the model that produced it.
Two reactor descriptions and their assumptionsOverlapping fault signals made diagnosis ambiguous.
Plant properties, fault combinations and observations varied across the scenarios. Rules for judging interventions, waiting and added sensing were fixed before evaluation; scenarios that failed those rules were excluded.
Scenario design and evaluation rulesThe campaign covered varying plants, faults and observations.
Small trials expanded to 99,790 scored fault scenarios across 12,499 synthetic plant configurations. Physical calculations and noisy observation tests were counted separately from scenarios.
Full simulation campaign resultsChanged assumptions exposed diagnostic failures.
The evaluation changed plant parameters, switched simulators and introduced unlisted fault combinations. Accepted and rejected demonstrations were retained so failed checks remained visible.
Assumption challenges and recorded demonstrationsSee the scale and model detail +
The full campaign count. Its result map uses the 64,241 scenarios retained after exclusion rules; the eight displayed examples are not a representative sample.
These include reaching starting conditions, generating records and matching alternative explanations. They are computer calculations, not distinct scenarios or physical experiments.
Random observation draws used to score the diagnostic method. They do not represent additional simulated physical trajectories.
The campaign varies 41 plant properties and 33 eligible fault mechanisms, with six kinds of fault combination and five observation setups. The two physical models track 66 and 146 changing quantities. Those counts describe computational scope, not proof of real-plant accuracy. Known hidden states allow the simulation to check whether an action truly adds useful evidence.
The outcome
Diagnostic advice did not reliably transfer between reactor models.
Among the 64,241 retained scenarios, changing conditions helps fully or partly in 33.9%, added sensing is needed in 8.2%, waiting suffices in 15.2%, and 42.7% remain unresolved within the tested options. A separate challenge tested whether those conclusions survived a different physical model.
Some faults needed an intervention; others needed time or another sensor.
One accepted example uses an experiment to distinguish a weakening pump from misleading alternatives. Other scenarios favor waiting or another measurement. Unresolved examples expose the limits of the available evidence.
Many conclusions did not survive the model-change test.
With a different physical representation, 690 of 1,427 reference conclusions keep their decision category: 48.4%. Failed or excluded comparison runs count as losses. Only 1,194 changed-model runs were successfully scored, so ignoring failures would overstate survival.
The quality check rejected a generated demonstration.
The first demonstration attempt fails a rule fixed before the run and is excluded. A second passes. Showing both explains what makes an acceptable diagnostic challenge instead of presenting every generated result as valid.
Limits of the consistency check
Unlisted fault combinations still produced confident wrong diagnoses.
Different plant physicsWhen the physical simulation changed, rejecting poorly fitting observations reduced confident wrong answers from 38.5% to 1.3%. The check rejected 85.2% of observation draws.
Unlisted fault combinationsFor fault combinations absent from the available explanations, 54.8% of observation draws still received a confident wrong diagnosis after that check. Only 9.9% were rejected.
An unlisted combination of faults can resemble a listed single explanation. Fitting the available choices well does not prove that the true explanation was among them.
Implication for evaluation
Diagnostic evaluation must test beyond the model’s known faults.
A system can fit the observed readings and still choose the wrong explanation. This collection provides cases for testing that weakness: overlapping fault signals, changed plant physics and causes missing from the diagnostic model.
A test collection for exposing diagnostic failures
A replayable collection of synthetic diagnostic challenges, with explicit comparisons of acting, waiting and adding information, plus evidence that conclusions can fail when assumptions change.
Real-plant performance and trained AI remain untested
- No trained AI system, customer model or operator was evaluated. Accuracy describes an idealized statistical diagnostic method on simulated observations.
- Both reactor models simplify the physical plant. The results do not establish operating safety or real-world diagnostic accuracy.
- The second simulation fails to reach a stable starting condition for roughly 13% of mapped configurations. Failed and excluded comparisons count against conclusion survival.
- The eight displayed scenarios are selected examples, not population estimates. Their traces were regenerated by the source simulation and contain one noisy reading sequence per strategy.
- Changing the score evaluation does not change the displayed physical replay. “Unresolved” applies only to the tested faults, actions, measurements and observation period.
- The supplied numerical checks and replay logs were reviewed. This page does not rerun or independently validate the physical models.
The evidence
The original results show which conclusions survived.
Unaltered supplied figures, with the model scope and final corrections kept beside them.
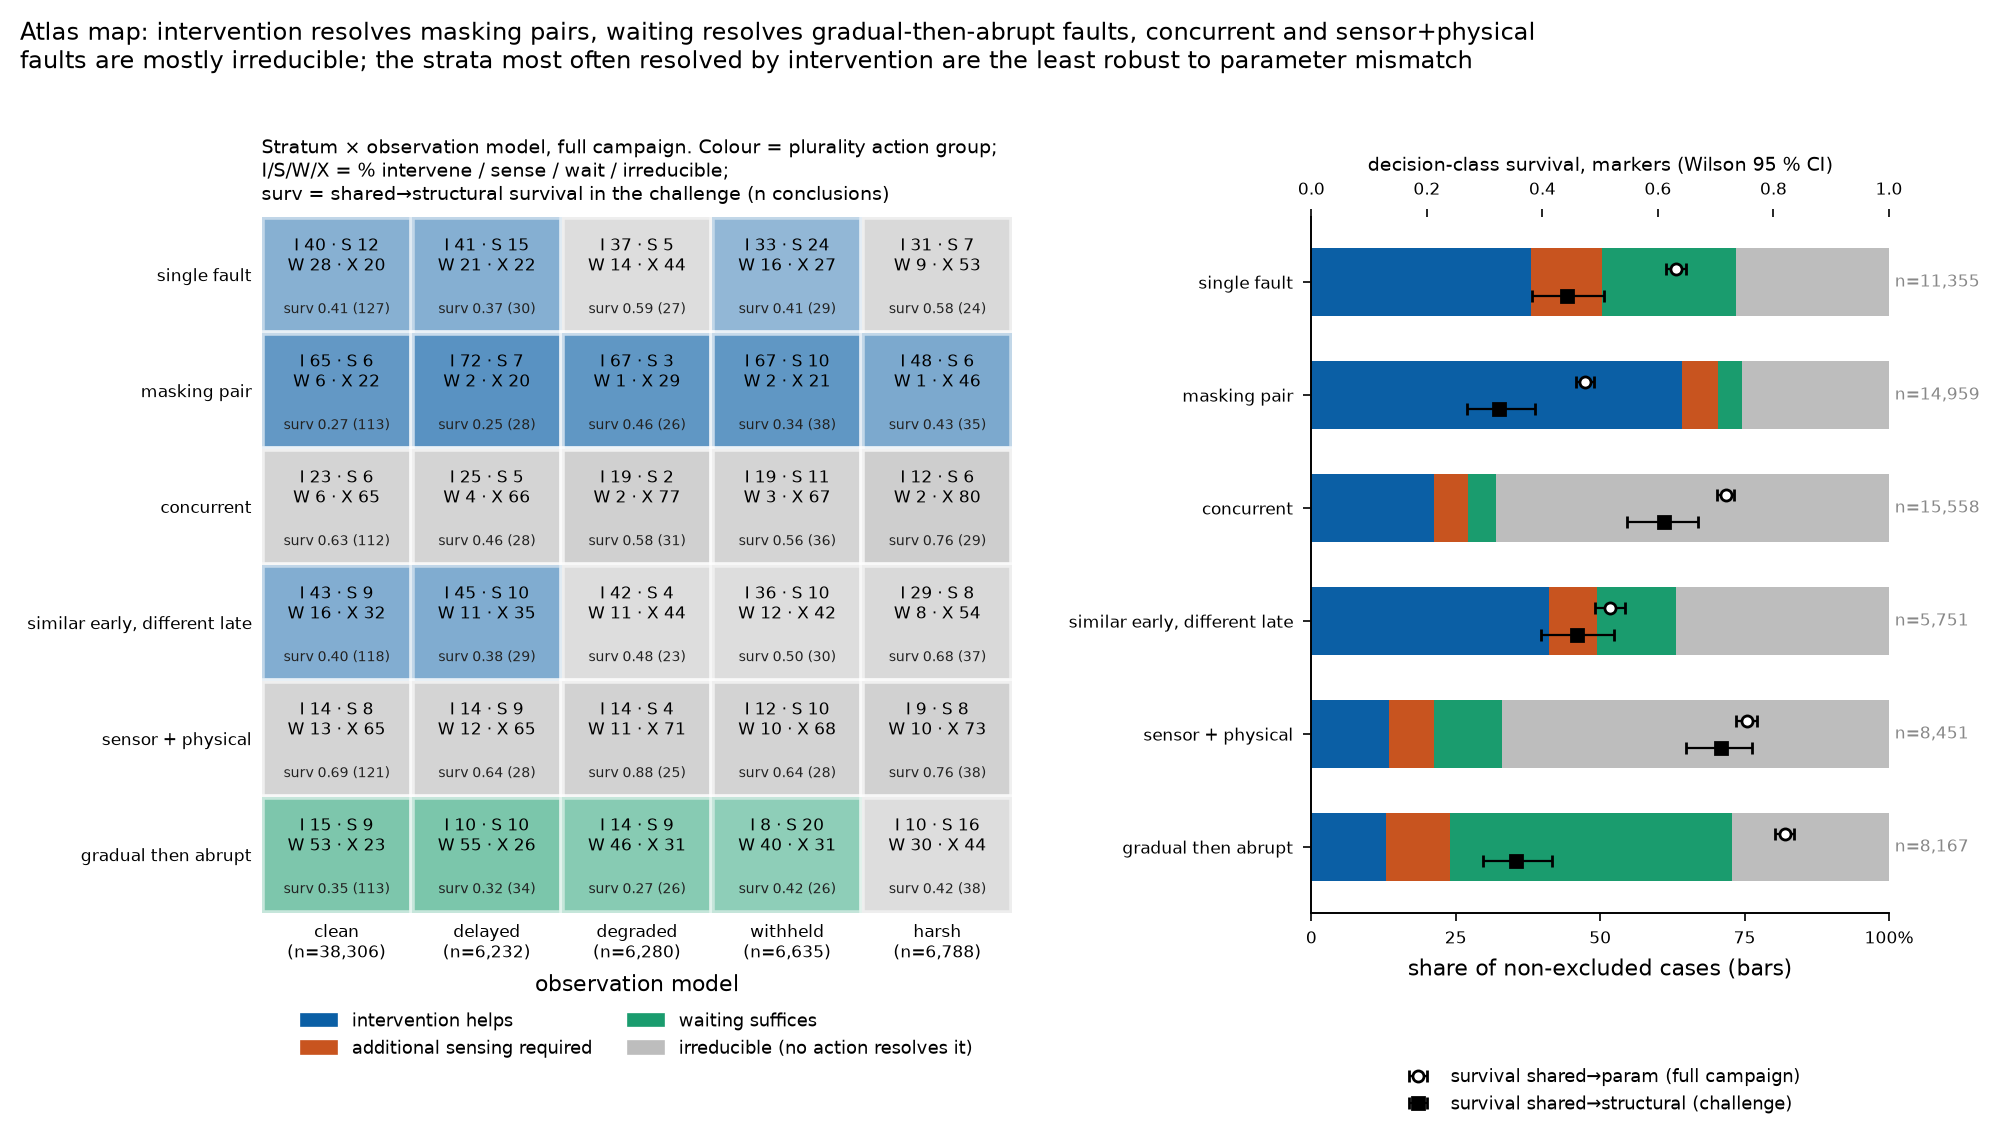
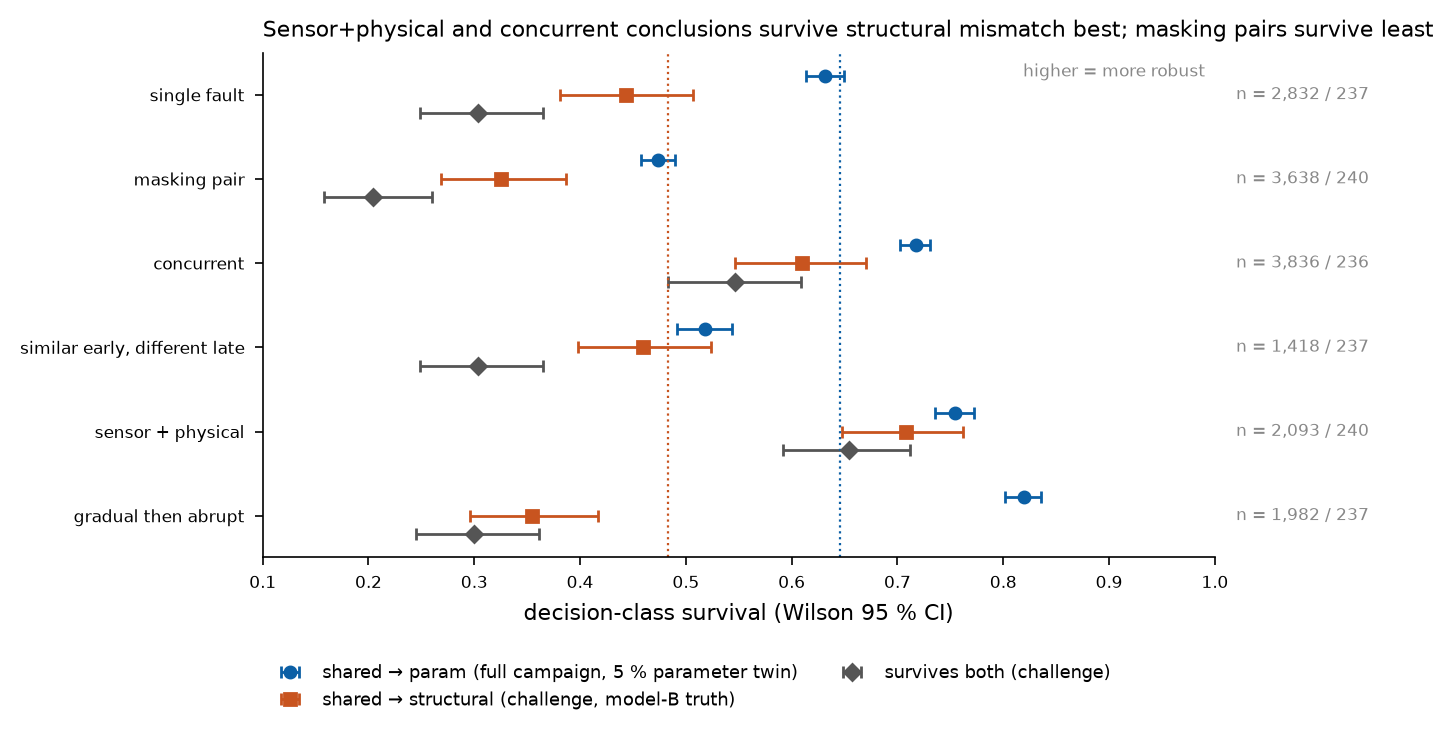
Read the source and interpretation notes +
Download the reviewed evidence notes ↓ · Download the displayed data ↓
Related simulations
Related simulations test robotic touch and power-system resilience.
Robotics · touch and control
Robotic finger design simulation
Simulate robotic fingers before fabrication. Compare skins, touch sensors and controllers across manipulation tasks.
Explore the simulationEnergy · connected-system resilience
Large-scale cyberattack simulation
Simulate cyber disruption and physical failures at a fictional energy company. Compare how defensive responses affect electricity delivery and business operations.
Explore the simulation